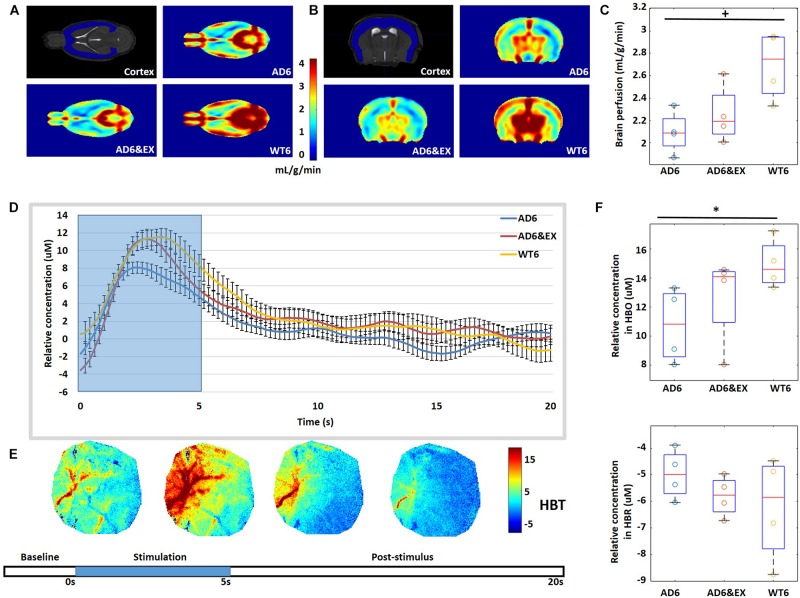
FIGURE 5.
(A,B) Typical 7-T MRI images, with coronal and axial views of the cortex. (C) Quantification of cerebral perfusion (ml/g/min) by MRI. (D) Averaged temporal response of oxy-hemoglobin (HBO) for all groups with 5-s stimulation (blue background). (E) Temporal dynamics of total hemoglobin (HBT) response to whisker stimulation. Stimulation lasted for 5 s, followed by a 15-s rest. (F) Averaged results for change in HBO (Δ[HBO](t)) and change in HBR (Δ[HBR](t)) over all mice. ∗p < 0.05 and +p < 0.1.

