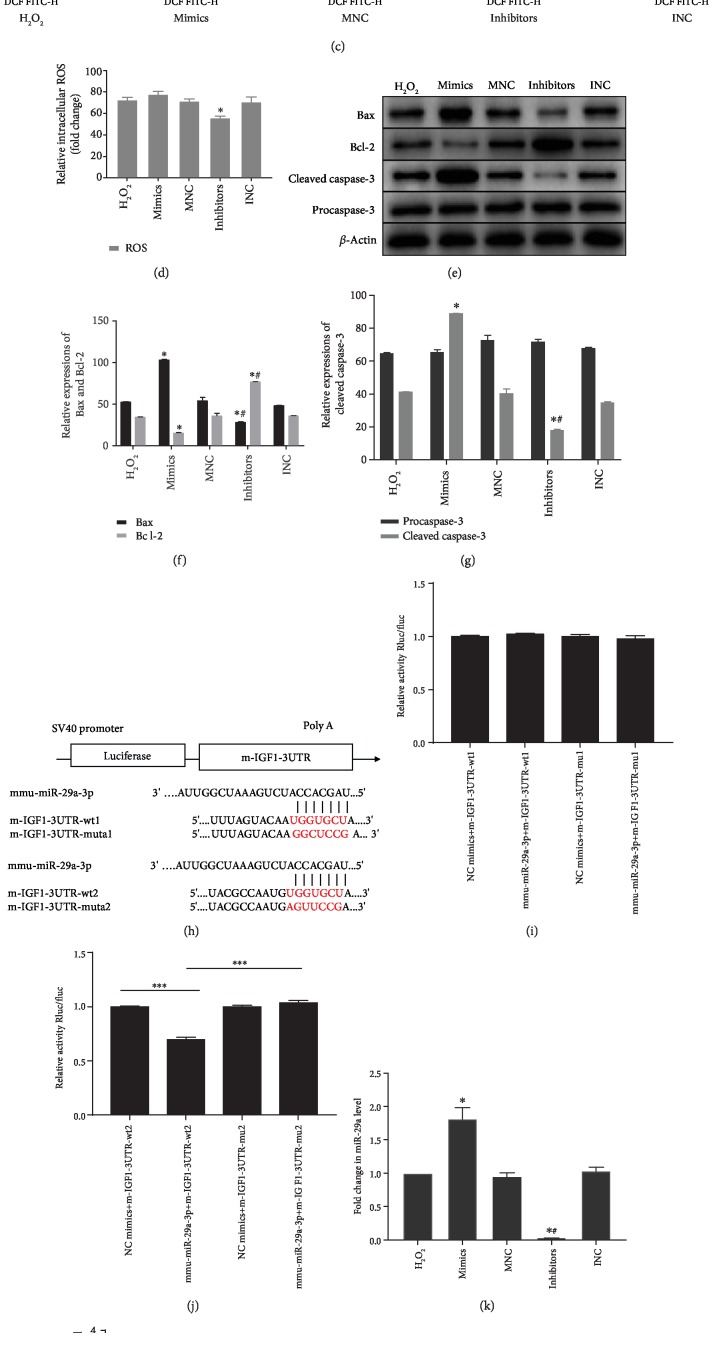
Figure 5.
Overexpression of miR-29a promotes apoptosis through targeting IGF-1 in CMVECs. (a) Representative dot plots of cell apoptosis after Annexin V/PI dual staining are shown. (b) The percentage of apoptotic cells represents both early and late apoptotic cells; n = 3. (c) The intracellular ROS level was determined by FCM. The P2 percentage indicates the proportion of cells with increased ROS production, with signals above the background 2′,7′-dichlorofluorescein (DCF) fluorescence levels. (d) Quantitative analysis of the ROS levels; n = 3. (e) Apoptosis-related genes, such as procaspase-3, cleaved caspase-3, Bax, and Bcl-2, were detected by immunoblotting. (f, g) Quantitative analysis of the apoptosis-related proteins; n = 3. (h) A schematic diagram of the putative binding between IGF-1 and miR-29a. (i, j) The relative luciferase activities were analyzed by cotransfecting miR-29a mimics or miR-NC and the luciferase reporter vectors pmirGLO-LGF-1-Mut or pmirGLO-IGF-1-WT. (k) qRT-PCR analysis of miR-29a expression in CMVECs after different treatments; n = 9. (l) qRT-PCR analysis of IGF-1 mRNA expression in CMVECs after different treatments; n = 9. (m) IGF-1 protein expression was detected by immunoblotting. (n) Quantitative analysis of IGF-1 protein expression; n = 3. ∗P < 0.05 compared with the H2O2 group; #P < 0.05 compared with the mimics group; ∗∗∗P < 0.05 compared with the NC-mimics-IGF1-WT group; ∗∗∗∗P < 0.05 compared with the Mmu-mimics-IGF1-WT group.

