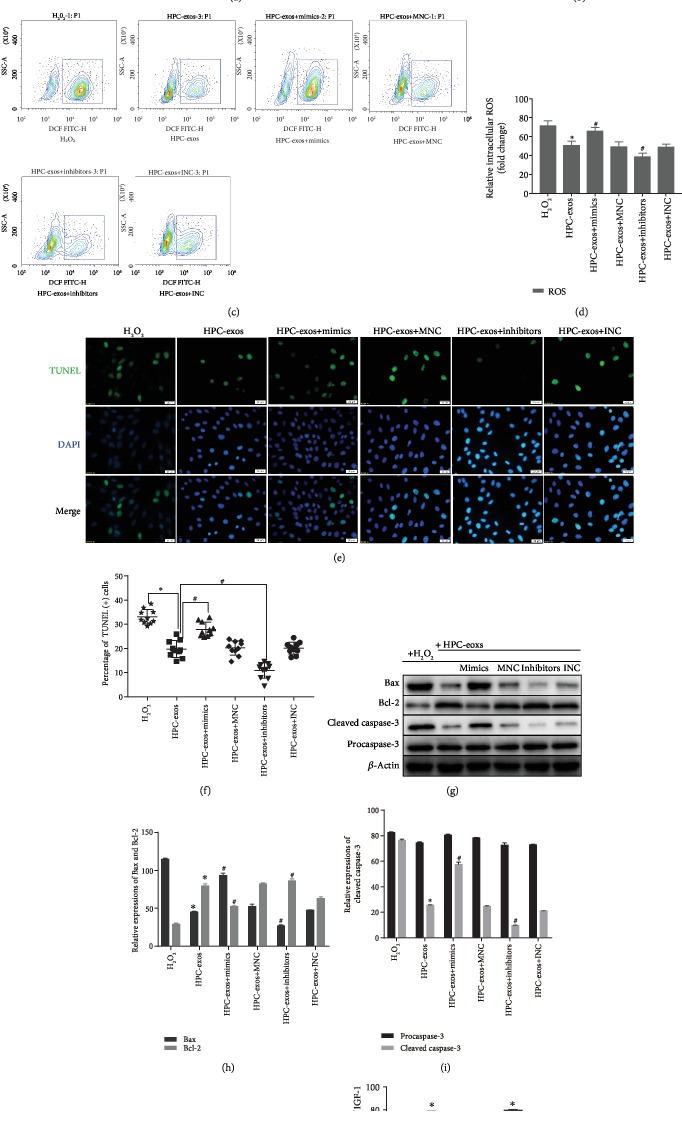
Figure 6.
HPC-exos protect against oxidative injury via miR-29a/IGF-1 in CMVECs. (a) Representative dot plots of cell apoptosis after Annexin V/PI dual staining are shown. (b) The percentage of apoptotic cells represents both early and late apoptotic cells; n = 3. (c) The intracellular ROS level was determined by FCM. The P2 percentage indicates the proportion of cells with increased ROS production, with signals above the background 2′,7′-dichlorofluorescein (DCF) fluorescence levels. (d) Quantitative analysis of ROS levels; n = 3. (e) Representative immunofluorescence of TUNEL (green) and DAPI (blue) staining and merged images. Photos were randomly captured using a fluorescence microscope. Scale bar = 20 μm. (f) The panel shows the percentage of TUNEL-positive cells; n = 6. (g) Apoptosis-related genes, such as procaspase-3, cleaved caspase-3, Bax, and Bcl-2, were detected by immunoblotting. (h, i) Quantitative analysis of the apoptosis-related proteins; n = 3. (j) IGF-1 protein expression was detected by immunoblotting. (k) Quantitative analysis of IGF-1 protein expression; n = 3. ∗P < 0.05 compared with the H2O2 group; #P < 0.05 compared with the HPC-exos group.

