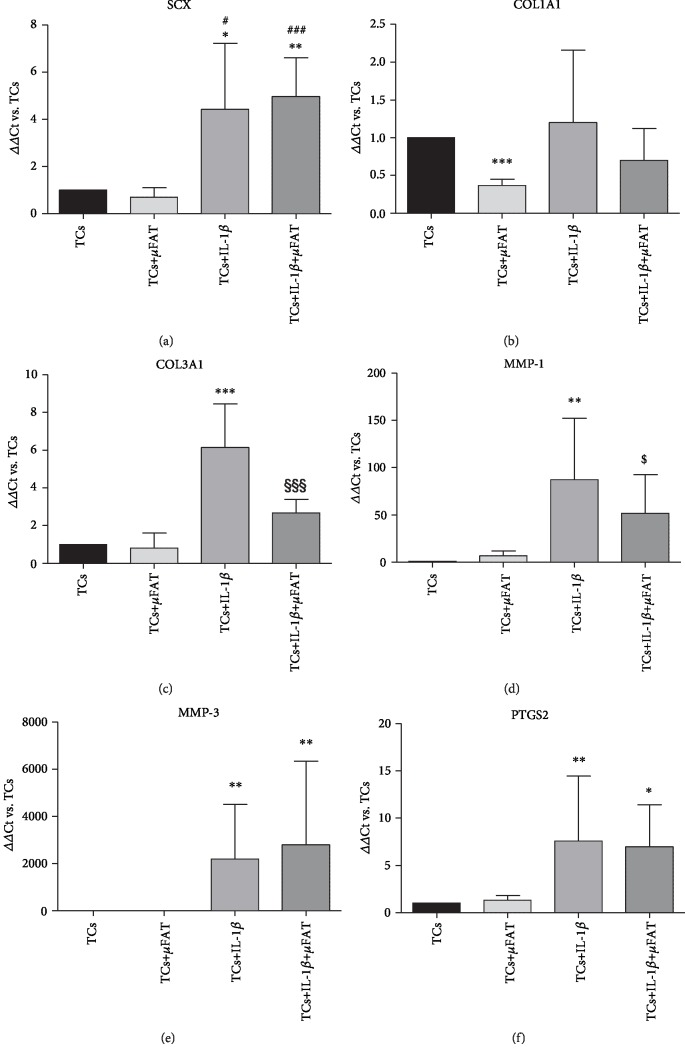
Figure 3.
Gene expression of SCX, COL1A1, COL3A1, MMP1, MMP3, and PTGS2 in TCs cultured in the presence of IL-1β and/or μFAT (n = 8). Data are expressed as mean ΔΔCt with respect to untreated controls (TCs = 1). ∗p < 0.05, ∗∗p < 0.01, ∗∗∗p < 0.001 vs. TCs; #p < 0.05, ###p < 0.001 vs. +μFAT; §§§p < 0.001 vs. +IL-1β; $p < 0.1 vs. +IL-1β (tendency).

