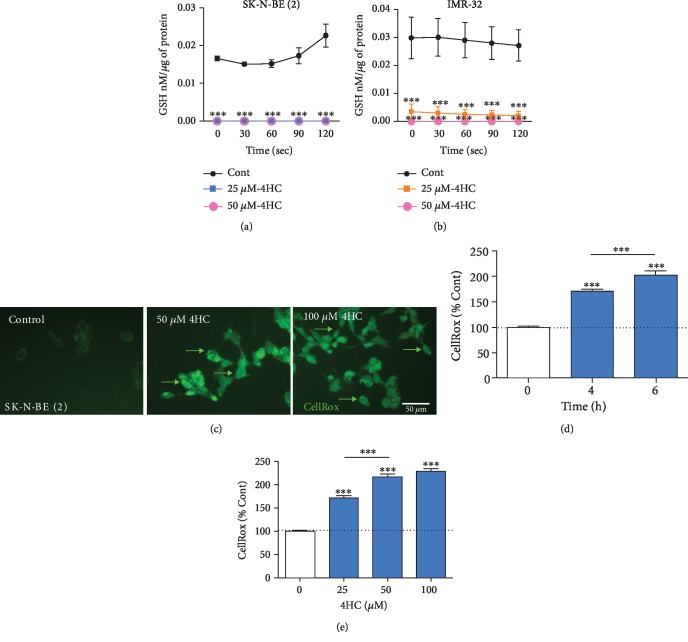
Figure 3.
4HC depletes the antioxidant glutathione and increases oxidative stress in NB cells. GSH concentration in (a) SK-N-BE (2) cells and (b) IMR-32 cells treated with 50 and 25 μM 4HC for 4 h. All data are mean ± SEM; n = 3 independent experiments. ∗p < 0.05 and ∗∗∗p < 0.01 versus control (Cont) at each time point; two-way ANOVA with Sidak's post hoc test. (c) Representative photomicrographs of CellRox fluorescence intensity in SK-N-BE (2) cells treated 50 or 100 4HC for 6 h. Arrows indicate elevated ROS levels in individual cells. Scale bar = 50 μm. CellRox fluorescence intensity as percentages of control in SK-N-BE (2) cells treated with (d) 25 μM 4HC for 2, 4, or 6 h and (e) 25, 50, or 100 μM 4HC for 2 h. All data are mean ± SEM of 360 cells from n = 3 independent experiments. ∗∗∗p < 0.001 versus control; ANOVA with Fisher's LSD test.

