
Figure 5.
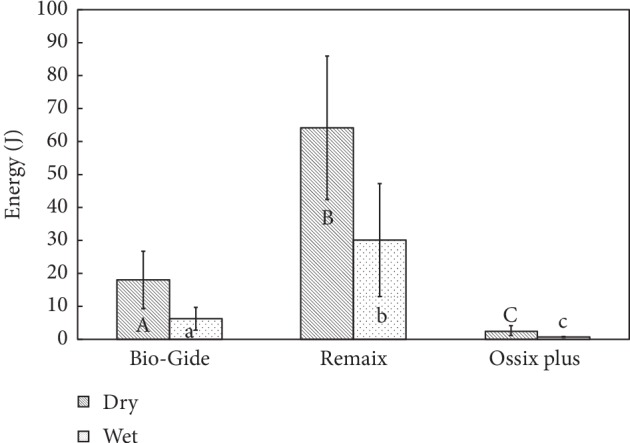
Comparison between the energy required for membrane tearing/failure which was calculated as the area under the curve (AUC). The energy (J) required for tearing membranes in dry and wet conditions (N = 10). Groups with different letters, upper case and lower case, per material and between materials are significantly different (p < 0.05).