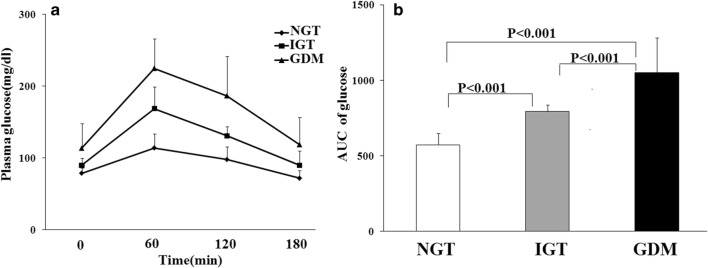
Fig. 1.
The graphs illustrate oral glucose tolerance test (OGTT) curves (a) and the area under the curve (AUC) of glucose levels OGTT (b) of normal glucose tolerance (NGT), impaired glucose tolerance (IGT) and gestational diabetes mellitus (GDM) subjects during the 100-g OGTT. Statistical differences were observed among NGT, IGT, and GDM groups (One-Way ANOVA followed by LSD post hoc test). Data are presented as means ± SD

