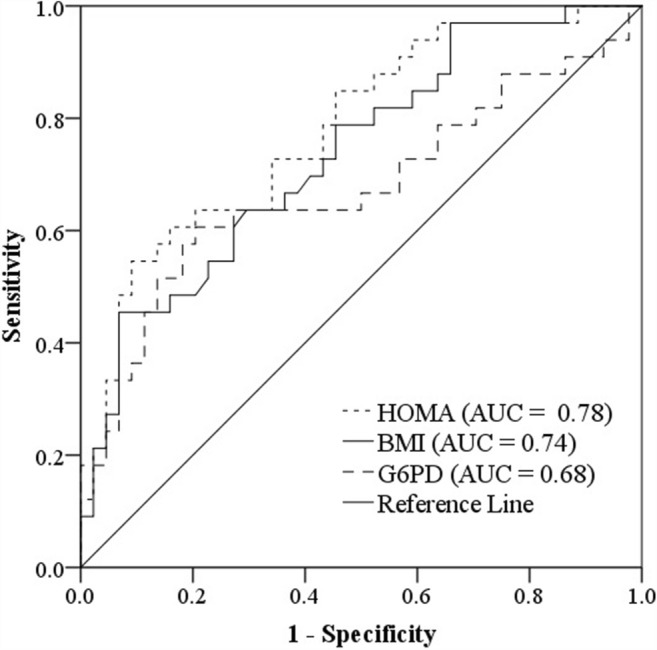
Fig. 2.

Receiver operator characteristic curves were used to compare the performance of HOMA-IR, BMI, and G6PD activity in the diagnosis of GDM, BMI, body mass index; HOMA-IR, homeostasis model assessment index for insulin resistance; G6PD, Glucose-6-phosphate dehydrogenase; AUC, area under the curve
