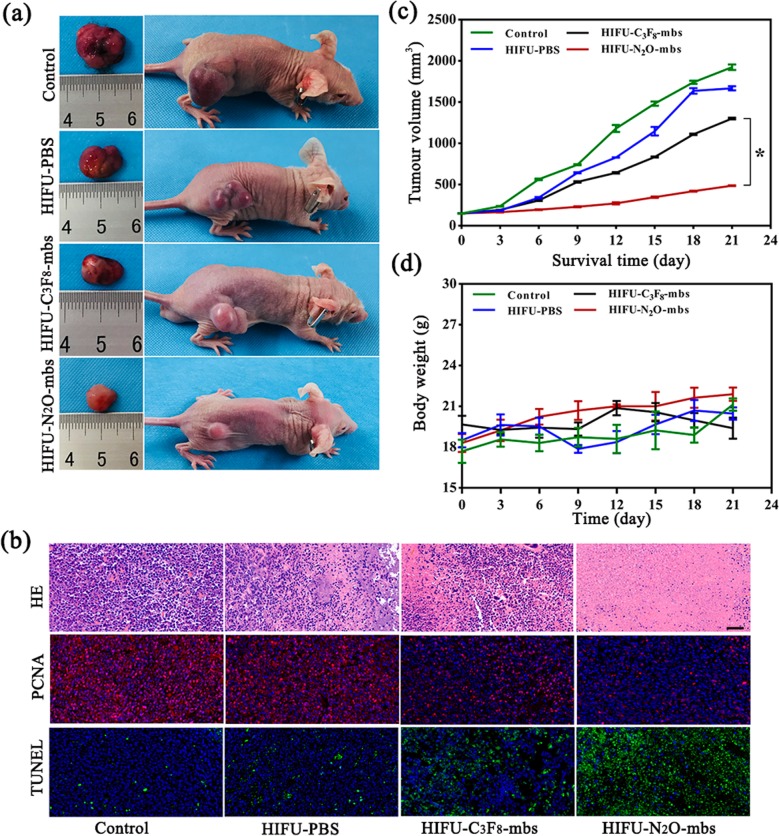
Fig. 7.
a Digital photos of tumor-bearing mice and ex vivo tumors 21 days after different treatments; b H&E, PCNA and TUNEL staining of tumor sections after various treatments; c the corresponding calculated tumor volume of each group after 21 days of different treatments; d body weight of tumor-bearing mice for each group. The scale bars in HE staining are 100 μm; the scale bars in TUNEL and PCNA staining are 50 μm. (The data were shown as mean ± SD, n = 5 per group, *p < 0.05, compared with HIFU-C3F8-mbs group)

