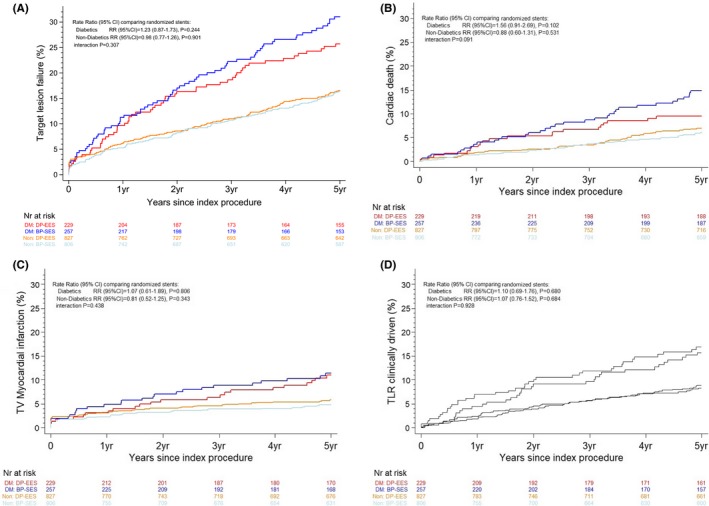
Figure 2.

Time to event curves for the composite end point target lesion failure and individual components of the primary end point up to 5 years in patients with diabetes mellitus (DM) vs patients without DM. A, Target lesion failure; B, cardiac death; C, target vessel (TV) myocardial infarction; D, clinically driven target lesion revascularization (TLR). Blue lines indicate biodegradable polymer sirolimus‐eluting stent, patients with DM subgroup (BP‐SES, DM); red lines indicate durable polymer everolimus‐eluting stent, patients with DM subgroup (DP‐EES, DM); grey lines indicate biodegradable polymer sirolimus‐eluting stent, patients without DM subgroup (BP‐SES, Non); and orange lines indicate durable polymer everolimus‐eluting stent, patients without DM subgroup (DP‐EES, Non). RR indicates rate ratio.
