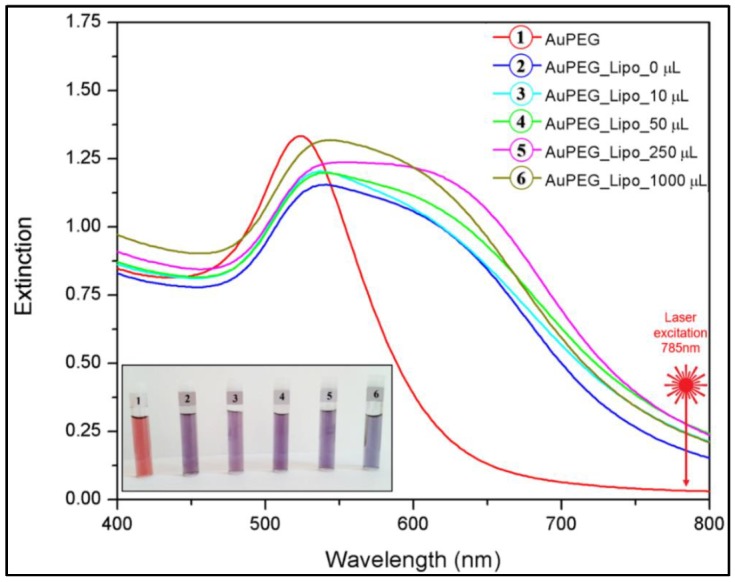
Figure 7.

VIS absorption spectra of the PEGylated gold colloids (1), and of the complexes they formed with pure liposomes (2) and MLPs containing different amounts of MNPs in their bilayers (3–6). The inset shows the optical images of the gold colloids and their liposomal complexes with their respective liposomal batch number: 1–0 μL, 2–10 μL, 3–50 μL, 4–250 μL, 5–1000 μL. The samples were diluted four times before image recording.
