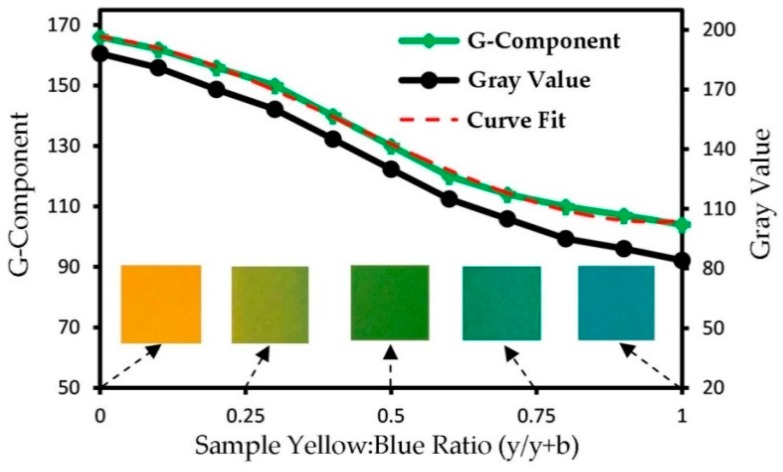
Figure 3.
Calibration of the green component and equivalent gray value for different sample concentration ratios (yellow to blue dye). Images of five ratios (from pure yellow to pure blue) are illustrated on the chart. A curve was fitted to find a practical correlation, used during the image-based MI assessment.

