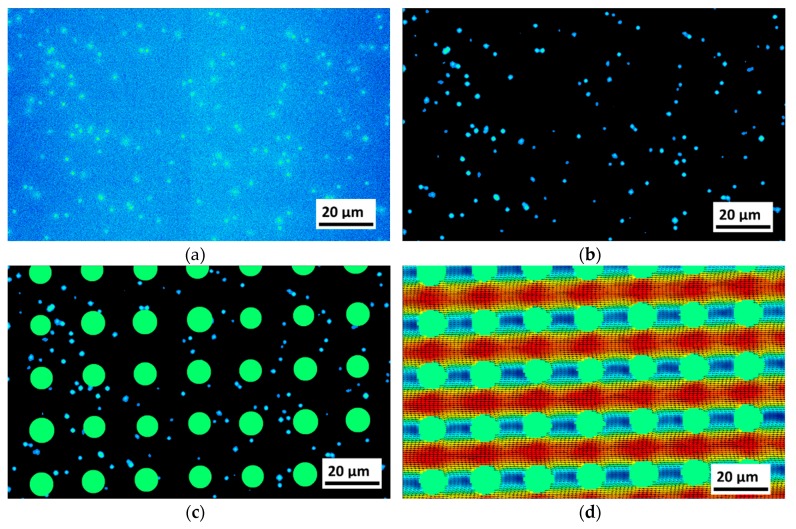
Figure 5.
Illustration of the image processing steps (example image taken for Re = 7.62): (a) The raw camera fluorescence image. In the center of the image, the brightness level slightly but abruptly changes, which is an artifact induced by the camera technology and does not cause problems with the image correlation procedures. (b) Image after post processing. (c) Image with post areas masked. (d) The final µPIV result of the measurement set consisting of 1500 frames. All Images show precisely the same area.

