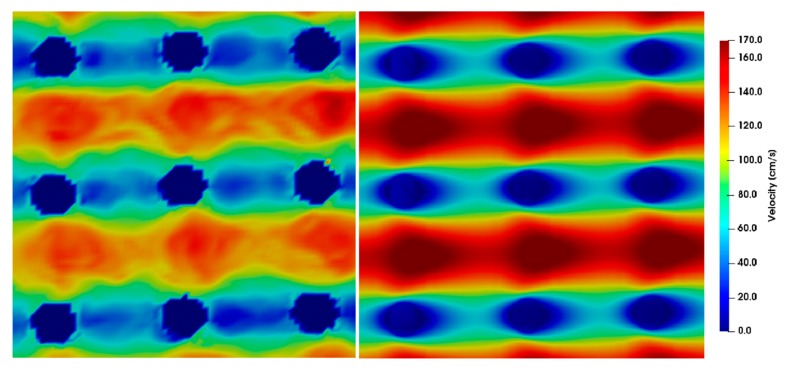
Figure 11.
µPIV measurements (left) compared to simulations (right) showing the velocity field around posts at Re = 15.24. The direction of flow is from left to right, the pitch between the posts is 20 µm and the time difference between double frames is dt = 1 µs. The µPIV measurements do not attain the maximum velocities achieved by the simulations.

