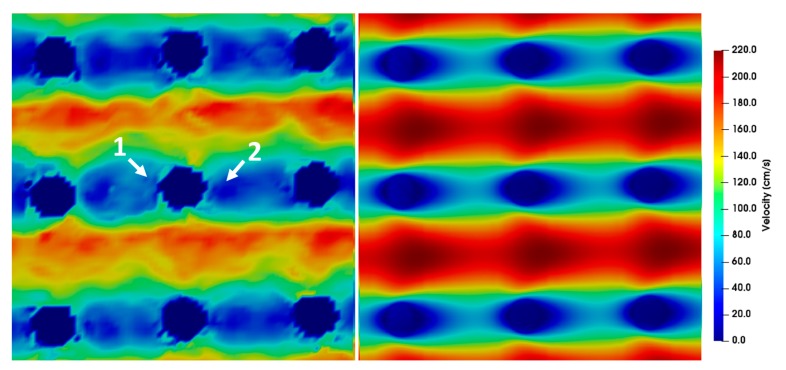
Figure 12.
µPIV measurements (left) compared to simulations (right) showing the velocity field around posts at Re = 19.05. The direction of flow is from left to right and the pitch between the posts is 20 µm and the time difference between double frames is dt = 0.8 µs. For a better highlighting of the asymmetry, two arrows are inserted into the picture. The velocity before the post is higher (arrow 1) than the velocity after the post (arrow 2). Furthermore, the µPIV measurements do not attain the maximum velocities achieved by the simulations.

