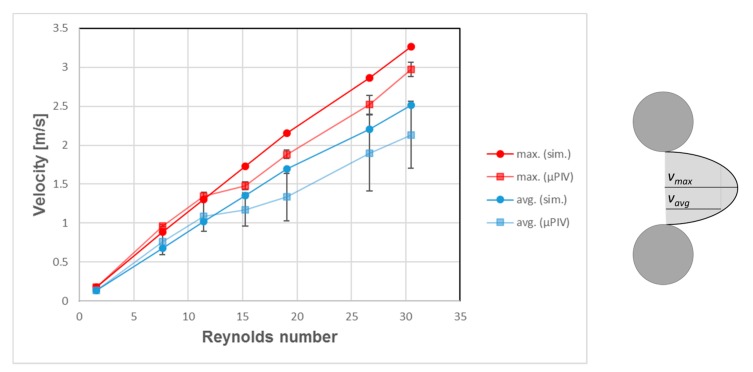
Figure 14.
Velocities (maximum and average between posts) depending on Reynolds number at median z layer. The simulation data shows a linear correlation between Reynolds number and both maximum and average velocity. The µPIV data, however, show that velocities do not continue to grow in proportion at Reynolds numbers higher than 15.

