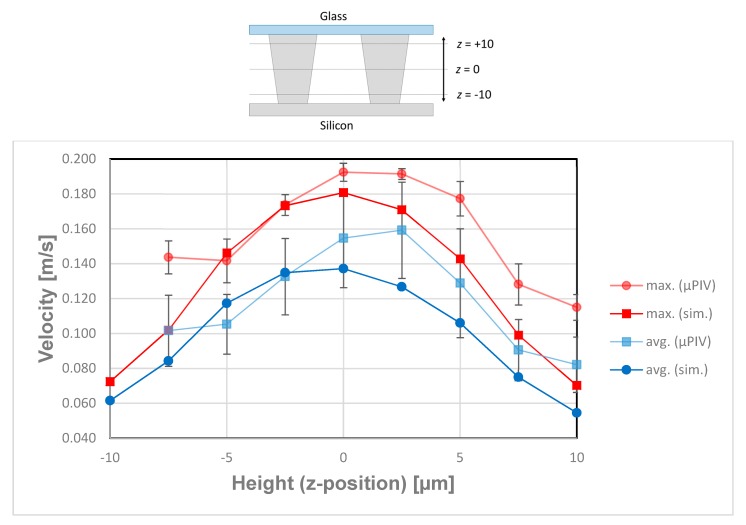
Figure 15.
Maximum and averaged velocities at Re = 1.52 between neighboring posts obtained by µPIV and simulations for varied focal depth (z-axis within the array). For this evaluation, for every layer, four rectangle areas between posts were chosen out of the µPIV velocity fields and the velocity maxima and mean values of these four areas were averaged.

