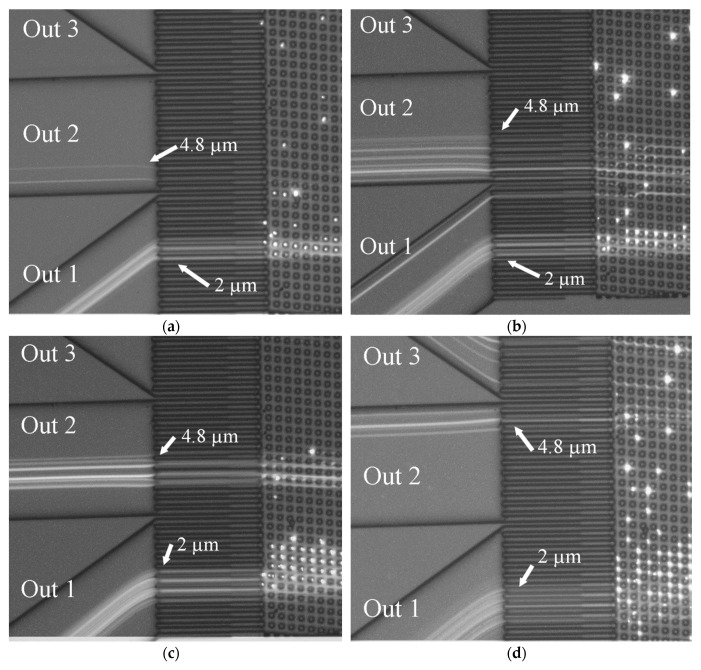
Figure 16.
Overlay of 200 video frames with the white light image of the DLD chip areas showing the fractionation position at the end of the array as obtained with fluorescent particles at a size of 2 µm and 4.8 µm for different velocities (Reynolds numbers). (a) Re = 0.5; (b) Re = 10; (c) Re = 15; (d) Re = 25.

