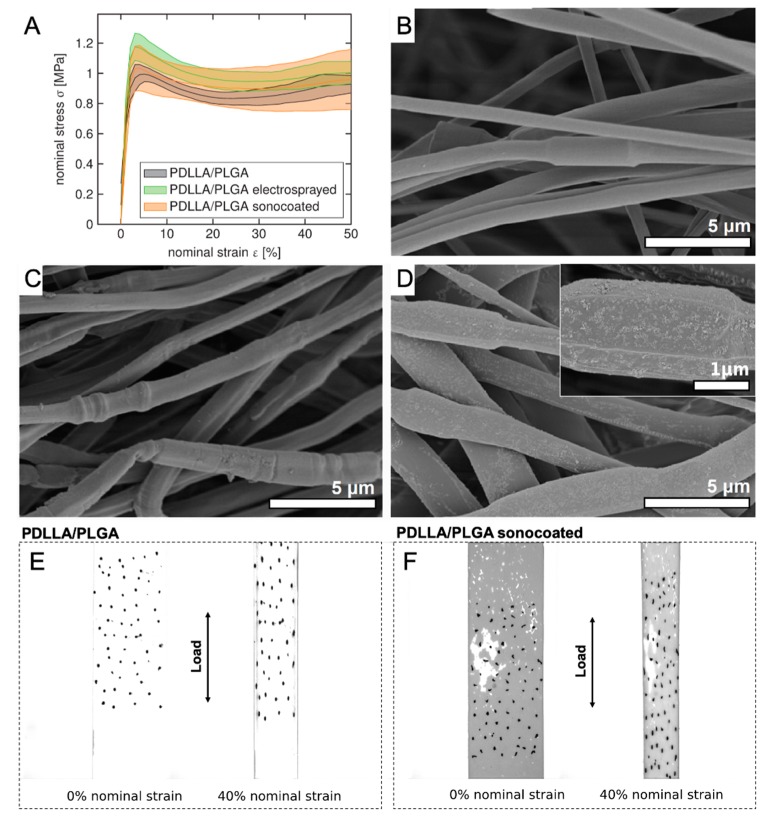
Figure 12.
(A) Nominal strain-stress curve for coated and non-coated samples. All graphs show mean and standard deviation (shaded areas) from n = 3. SEM images of samples after tensile tests: (B) PDLLA/PLGA; (C) PDLLA/PLGA/nHA electrosprayed, and (D) PDLLA/PLGA/nHA sonocoated. Optical CCD camera images of (E) PDLLA/PLGA and (F) PDLLA/PLGA/nHA sonocoated during tensile properties testing in PBS.

