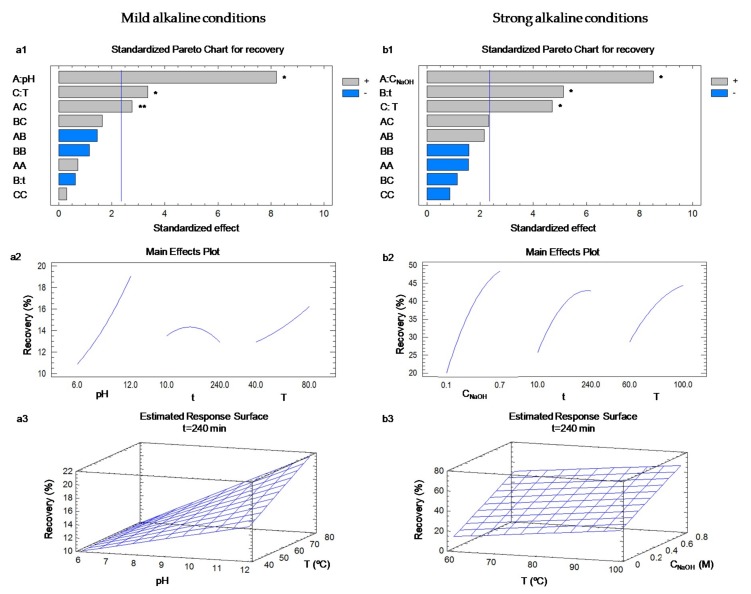
Figure 3.
Pareto charts indicating the weight of each factor on the protein recovery and corresponding main effects plots using (a1 and a2, respectively) mild and (b1 and b2, respectively) strong alkaline conditions. The surface plots are represented take into account the significant factors: (a3) mild and (b3) strong alkaline conditions. CNaOH, NaOH concentration; T, temperature; t, extraction time. * Significant at p-value < 0.05; ** significant at p-value < 0.1.

