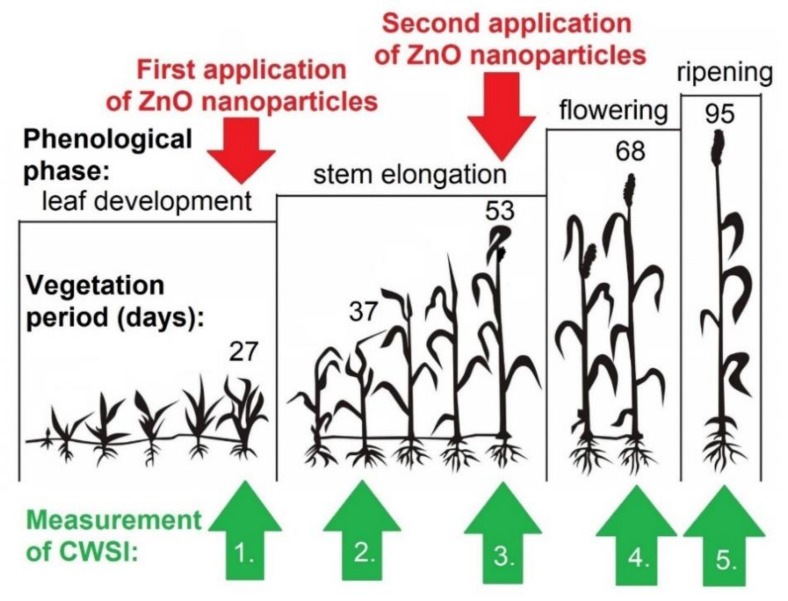
Figure 3.
Schematic illustration of the crop phenological phases; the red arrows indicate the two vegetation periods at 27 and 53 days of foliar spray application with 2.6 mg.L−1 zinc oxide nanoparticle concentration. The green arrows record the crop water stress index refraction measurements (CWSI).

