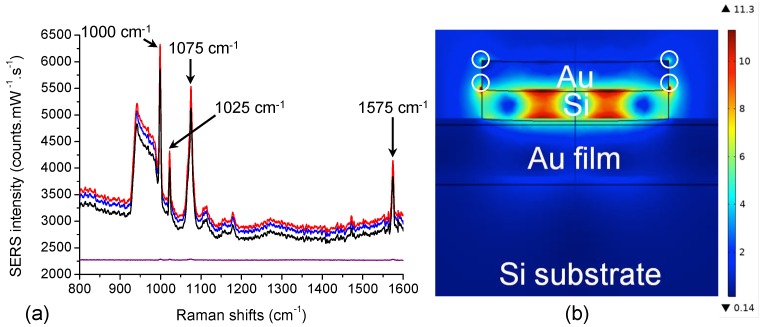
Figure 4.
(a) SERS spectra of thiophenol realized on 3 distinct SERS substrates among 10 for the excitation wavelength of 785 nm. In purple is represented the SERS spectrum of thiophenol (1 mM) obtained on a 40-nm gold film at the same excitation wavelength (an offset is applied to the purple spectrum to see all the SERS spectra). (b) Electric field mapping of a hybrid Au/Si nanodisk on gold film for an excitation wavelength of 785 nm (cross-sectional view). White circles correspond to the strong electric field zones accessible for thiophenol molecules.

