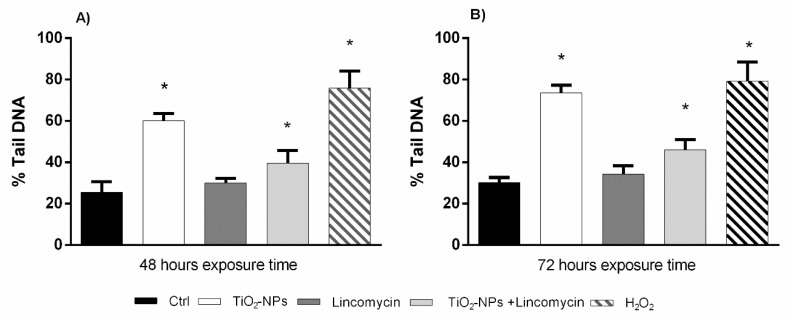
Figure 5.
Percentage of DNA in the tail of the comet in amniotic cells (ordinate) after 48 h exposure time (A) and after 72 h exposure time (B) to TiO2-NPs, lincomycin and their combination (abscissa). The dark bar is negative control; the white bar is 10 μg/L TiO2-NPs treated cells; the dark grey bar is 100 mg/L lincomycin treated cells; the light grey bar is 10 μg/L TiO2-NPs + 100 mg/L lincomycin treated cells; the striped bar is 10 mM H2O2 treated cells. * p ≤ 0.05.

