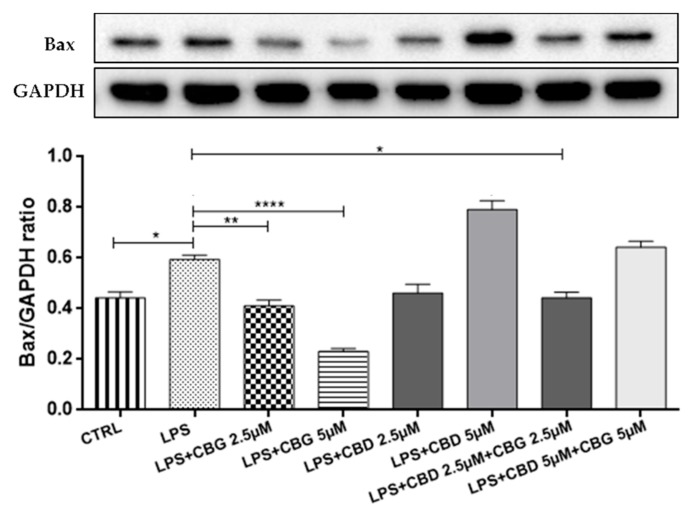
Figure 7.
Western blot analysis for Bax. The pre-treatment with CBG alone at 2.5 and 5 µM doses and in combination with CBD at a 2.5 µM dose shows a reduction of Bax expression compared to the LPS group. * p < 0.05, ** p < 0.01, **** p < 0.0001 vs. LPS. The blot is representative of three independent experiments. The densitometry analysis of bands representing means (±SEM) of three independent experiments in which levels of each protein were normalized for GAPDH.

