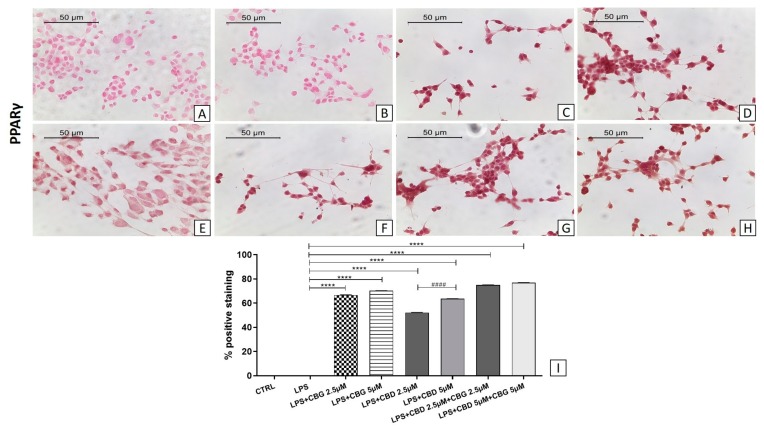
Figure 9.
Immunocytochemical analysis for PPARγ in untreated NSC-34 cells (CTRL) (A), cells incubated with medium of LPS-stimulated macrophages (LPS) (B), LPS + CBG 2.5 µM (C), LPS + CBG 5 µM (D), LPS + CBD 2.5 µM (E), LPS + CBD 5 µM (F), LPS + CBG 2.5 µM + CBD 2.5 µM (G), LPS + CBG 5 µM + CBD 5 µM (H). Densitometric analysis for PPARγ (I), **** p < 0.0001 vs. LPS; #### p < 0.0001 LPS + CBD 2.5 µM vs. LPS + CBD 5 µM. The data are representative of three independent experiments. Scale bar: 50 µm. The images were acquired with an objective 40×.

