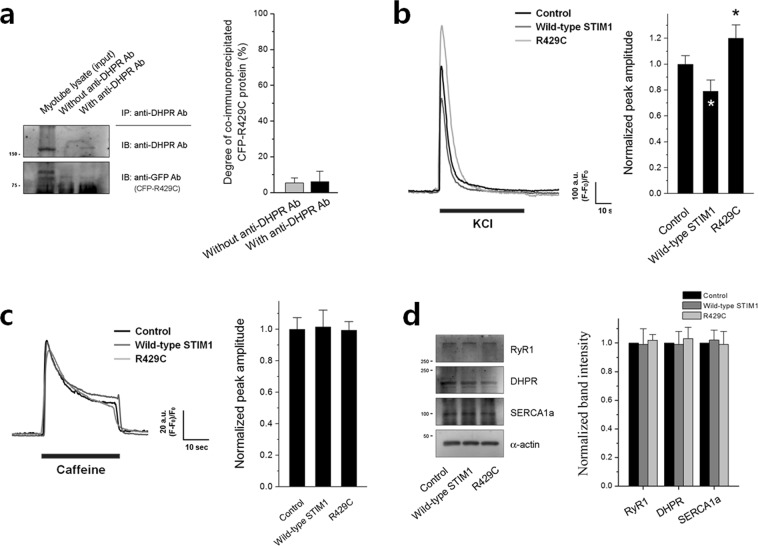
Figure 3.
Intracellular Ca2+ movements. (a) Co-immunoprecipitation assay of DHPR with R429C was conducted using the lysate of R429C-expressing myotubes and anti-DHPR antibody. Myotube lysate refers to the lysate of R429C-expressing myotubes. A representative result is presented. Degree of co-immunoprecipitated R429C to the corresponding total protein is presented as histograms in the right-hand side. Significant difference was compared with ‘Without anti-DHPR Ab’ (p < 0.05) and there was no significant difference. The values are presented as the mean ± s.e.m. for the number of experiments shown in the parentheses of Supplementary Table S4. KCl (b) or caffeine (c) was applied to R429C-expressing myotubes, and intracellular Ca2+ movement from the SR to cytosol through RyR1 was measured. A representative trace for each group is shown. Histograms on the right-hand side show the peak amplitude normalized to the mean value of the control. The results are presented as the mean ± s.e.m. for the number of experiments shown in parentheses in Table 1. *Significant difference when compared with the control (p < 0.05). (d) The lysate of R429C-expressing myotubes was subjected to immunoblot assays with antibodies against RyR1, DHPR, or SERCA1a. α-actin was used as a loading control. The expression level of each protein normalized to the mean value of the control is presented as histograms on the right-hand side. Significant difference compared with the control (p < 0.05) and there was no significant difference. The values in (a) and (d) are presented as the mean ± s.e.m. for the number of experiments shown in the parentheses of Supplementary Tables S3 and S4, respectively. The blots that were cropped from different gels were grouped in (a) and (d), and the full-length blots are presented in Supplementary Figs. S6 and S7.

