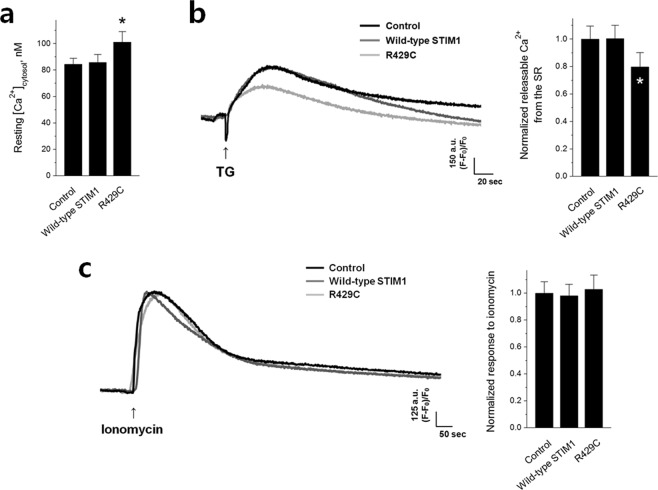
Figure 4.
Cytosolic Ca2+ levels, releasable Ca2+ from the SR, and total cellular Ca2+ levels. (a) Cytosolic Ca2+ levels at rest were measured in R429C-expressing myotubes, and the mean values are summarized as histograms. (b) Releasable Ca2+ from the SR to the cytosol was measured by treatment with TG (2.5 μM) in the absence of extracellular Ca2+. (c) Total cellular Ca2+ levels were measured by treatment with ionomycin (5 μM) in the absence of extracellular Ca2+. A representative trace for each group is shown in. (b,c) The normalized mean values of each to the mean value of the control are summarized as histograms on the right-hand side. The values are presented as the mean ± s.e.m. for the number of myotubes shown in parentheses in Table 1. *Significant difference compared with the control (p < 0.05).

