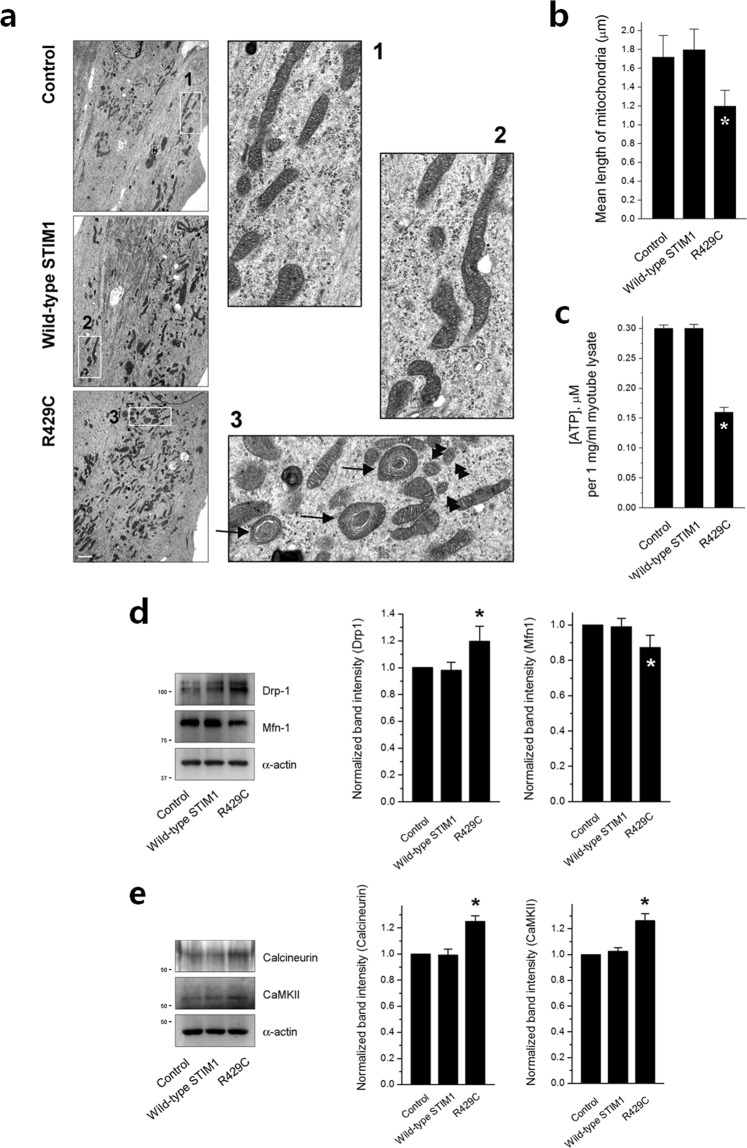
Figure 5.
Mitochondrial shape, ATP level, and expression level of mitochondrial fusion- or fission-related proteins. (a) Mitochondria in R429C-expressing myotubes were observed using TEM. Areas in the numbered boxes (from 1 to 3) were enlarged. Mitochondria with onion-shaped cristae in R429C-expressing myotubes are indicated by black arrows in the enlarged image 3. Representative small mitochondria in R429C-expressing myotubes are indicated by black double arrowheads in the enlarged image 3. The bar represents 2 µm. (b) The length of mitochondria with normal shapes (except mitochondria with onion-shaped cristae) was measured in the unit area (37.5 × 25 µm2). The results are presented as histograms. The values are presented as the mean ± s.e.m. for the unit areas shown in parentheses in Table 2. (c) ATP levels in R429C-expressing myotubes were measured using the lysate of R429C-expressing myotubes (1 mg/ml). The lysate of R429C-expressing myotubes was subjected to immunoblot assays with antibodies against mitochondrial fusion- or fission-mediating proteins (d) or regulatory proteins (e). α-actin was used as a loading control. The normalized expression level of each to the mean value of the control is presented in histograms on the right-hand side. The values in (c), (d,e) are presented as the mean ± s.e.m. for three independent experiments (Table 2). *Significant difference compared with the control (p < 0.05). The blots that were cropped from different gels were grouped in (d,e), and the full-length blots are presented in Supplementary Figs. S8 and S9.

