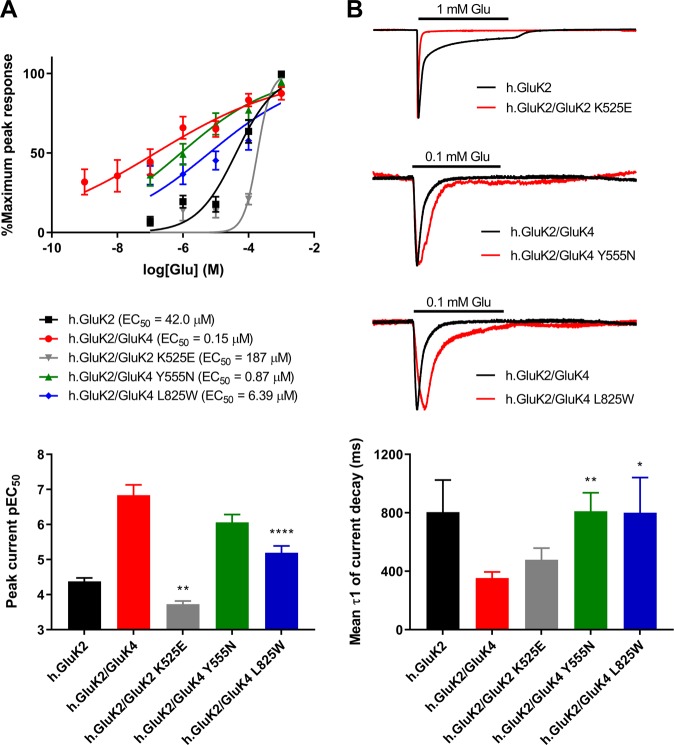
Figure 3.
Altered channel properties of GluK2 and GluK4 mutants. (A) Top: Glutamate concentration-response curves for wild type GluK2 and GluK2/GluK4 receptors and the mutated GluK2/GluK2 K525E, GluK2/GluK4 Y555N and GluK2/GluK4 L825W subunit combinations. Points are mean % of maximum peak response ± SEM and curves are fits of the Hill equation. Bottom: Comparisons of pEC50 for wild type and mutated GluK2 K525E, GluK4 Y555N, GluK4 L825W KARs. (B) Top: Two microelectrode voltage clamp (TEVC) traces for wild type and mutant GluK2 K525E, GluK4 Y555N, GluK4 L825W KARs in response to a 10-s application (bar) of 1 mM glutamate (for wild type and mutated GluK2 receptors) or 0.1 mM glutamate (for wild type and mutated GluK2/GluK4 receptors) at −80 mV. The responses have been scaled such that the peak responses are equal to aid comparison of the current decay kinetics, hence there are no vertical scale bars. Bottom: Comparisons of current decay τ1 values for wild type and mutated GluK2 K525E, GluK4 Y555N, GluK4 L825W KARs. Statistically significant differences are indicated by *(p < 0.05), **(p < 0.01) or ****(p < 0.0001). Abbreviations: Glu, glutamate; hGluK2, human GluK2; KA, kainic acid, pEC50: negative logarithm of the EC50 value.

