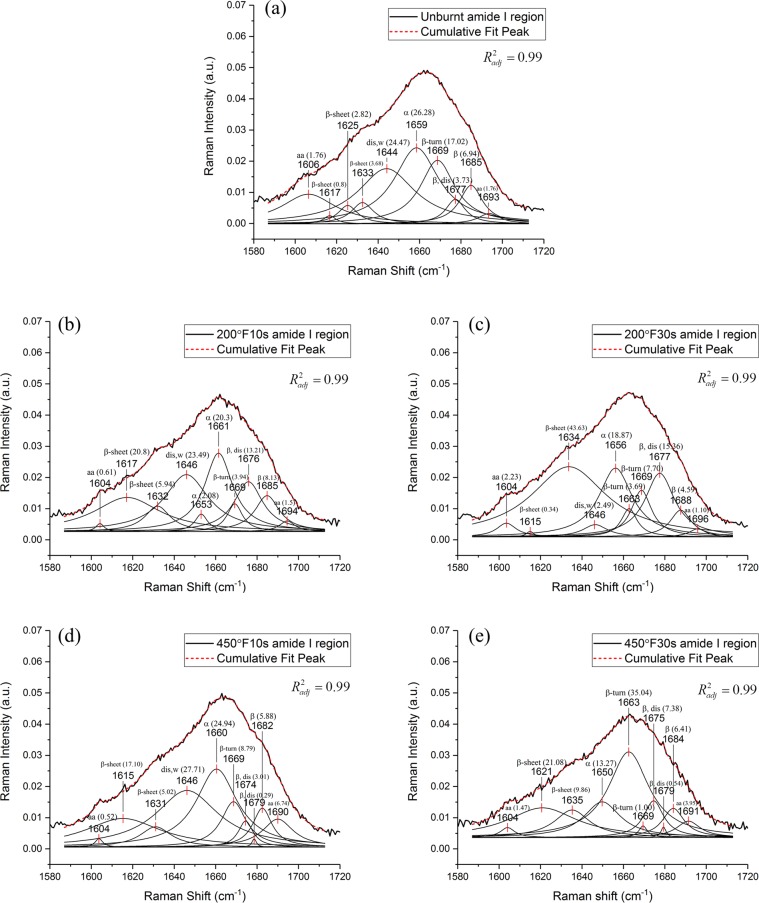
Figure 4.
Deconvolution of the amide I region of the Raman spectra of ex vivo porcine skin. (a) Unburnt skin, (b) Skin burnt at 200 °F for 10s, (c) Skin burnt at 200 °F for 30 s, (d) Skin burnt at 450 °F for 10 s, (e) Skin burnt at 450 °F for 30 s. The percentage of area under each curve is shown in bracket. Abbreviations: α – α-like helix, β – β sheets and β turns, dis – disordered structures, w – free and hydrogen bonded water, aa – amino acids. R2adj = 0.99 for all the cases, indicating good fit, and the fitting curves are presented along with the data curve for visualization of the fitted results.

