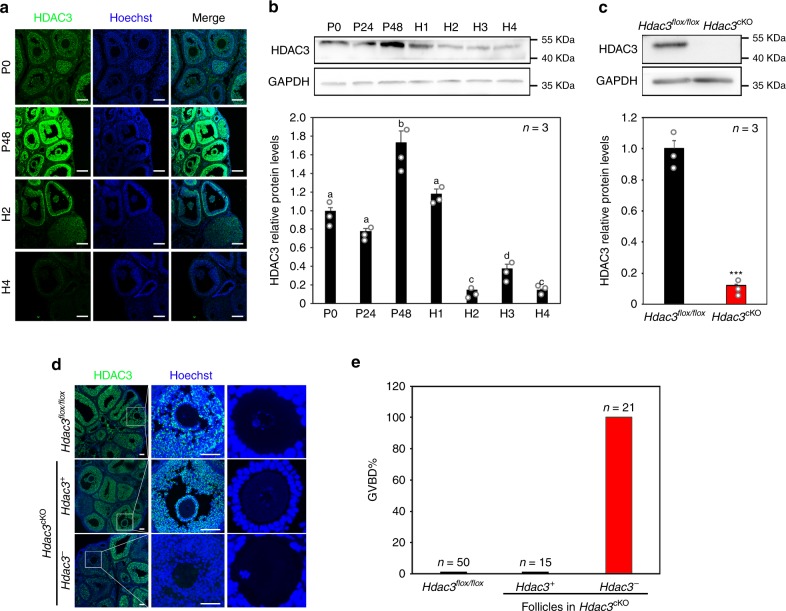
Fig. 1. HDAC3 negatively regulated oocyte maturation.
a HDAC3 (green) levels in GCs decreased dramatically in response to hCG stimulation. Nuclei were dyed with Hoechst (blue). Scale bar = 100 µm. n = 3 biologically independent experiments. b HDAC3 protein levels were upregulated by PMSG and downregulated by hCG in a time-dependent manner. P48: 48 h after PMSG treatment, equivalent to 48 h after the FSH surge. H1–H4: 1–4 h after hCG treatment, equivalent to 1–4 h after the LH surge. n = 3 biologically independent experiments. Data are presented as mean ± SEM, and different letters (a–d) indicate significant differences among groups (two-sided ANOVA test), P (a, b) < 0.05, P (a, c) < 0.01, P (a, d) < 0.01, P (b, c) < 0.001, P (b, d) < 0.01, P (c, d) < 0.05. c Hdac3 knockout efficiency was examined and quantified by western blotting analysis. n = 3 biologically independent experiments. Data are presented as mean ± SEM. Asterisks (*) indicate significant differences at ***P = 0.00007 determined by the two-sided t test. d HDAC3 (green) immunostaining in the different mouse models revealed oocyte maturation independent of LH in follicles lacking Hdac3 expression (Hdac3-) in GCs, whereas oocytes in Hdac3-positive (Hdac3+) follicles remained in the GV stage, similar to the situation in Hdac3flox/flox mice. Scale bar = 100 µm. Nuclear DNA in indicated in blue (Hoechst). e Oocyte maturation (GVBD) rates in follicles with or without HDAC3 expression in the different mouse genotypes. Source data are provided as a Source Data file.

