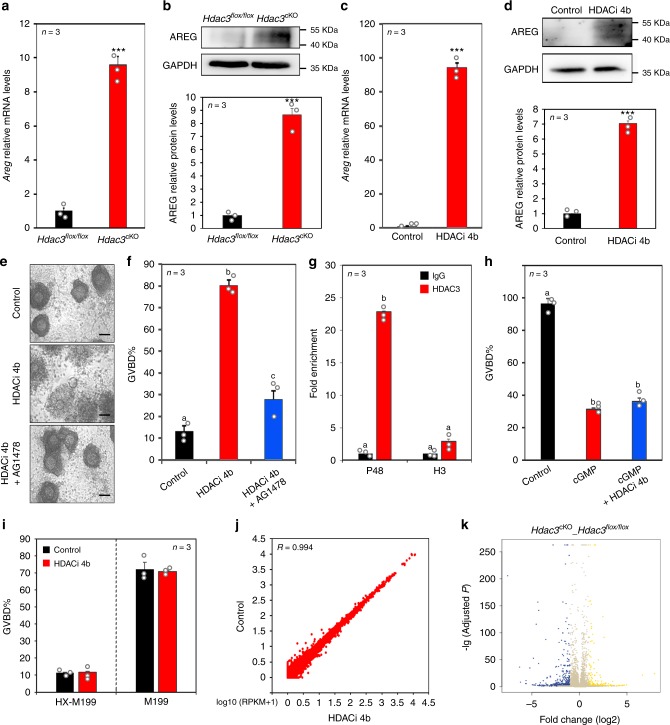
Fig. 2. HDAC3 repressed AREG expression in GCs before the LH surge.
a Quantitative real-time PCR revealed Areg expression in Hdac3flox/flox and Hdac3cKO GCs after PMSG treatment. Data are presented as mean ± SEM. Asterisks (*) indicate significant differences at ***P = 0.000003 determined by the two-sided t test. b AREG levels in Hdac3flox/flox and Hdac3cKO GCs were quantified by western blotting analysis. n = 3 biologically independent experiments. Data are presented as mean ± SEM. Asterisks (*) indicate significant differences at ***P = 0.0009 determined by the two-sided t test. c Quantitative real-time PCR showed that inhibiting HDAC3 increased Areg expression in GCs in vitro. HDACi 4b, an HDAC3 inhibitor. Data are presented as mean ± SEM. Asterisks (*) indicate significant differences at ***P = 5.15E−5 determined by the two-sided t test. d AREG levels in control and HDACi 4b-treated GCs were quantified by western blotting analysis. n = 3 biologically independent experiments. Data are presented as mean ± SEM. Asterisks (*) indicate significant differences at ***P = 3.27E−5 determined by the two-sided t test. e Representative images demonstrate the effect of GC-derived HDAC3 on cumulus cell expansion within in vitro cultured COCs. Scale bar = 100 µm. n = 3 biologically independent experiments. f Oocyte maturation (GVBD) rates were significantly improved by HDACi 4b, and this effect was reversed by AG1478. AG1478, EGFR inhibitor. n = 3 biologically independent experiments. Data are presented as mean ± SEM, and different letters (a–c) indicate significant differences among groups (two-sided ANOVA and Holm–Šidák test), P (a, b) < 0.001, P (a, c) < 0.05, P (b, c) < 0.001. g ChIP-qPCR analysis of HDAC3 at the Areg promoter (−343 to −150) before and after the LH surge. n = 3 biologically independent experiments. Data are presented as mean ± SEM, and different letters (a–b) indicate significant differences among groups (two-sided ANOVA and Holm–Šidák test), P (a, b) < 0.001. h HDACi 4b was unable to rescue 8-Br-cGMP-mediated inhibition of oocyte maturation (GVBD). Data are presented as mean ± SEM, and different letters (a–b) indicate significant differences among groups (two-sided ANOVA and Holm–Šidák test), P (a, b) < 0.001. i HDACi 4b had no direct effect on denuded oocyte meiotic maturation. j Scatter plot comparison of oocyte transcripts between the control and HDAC3 inhibitor groups revealed that HDACi 4b had no effect on oocyte developmental competence. Pearson statistical test used for statistical analysis. k Volcano plot of transcriptomic analysis of GCs isolated from Hdac3flox/flox and Hdac3cKO ovaries. Source data are provided as a Source Data file.

