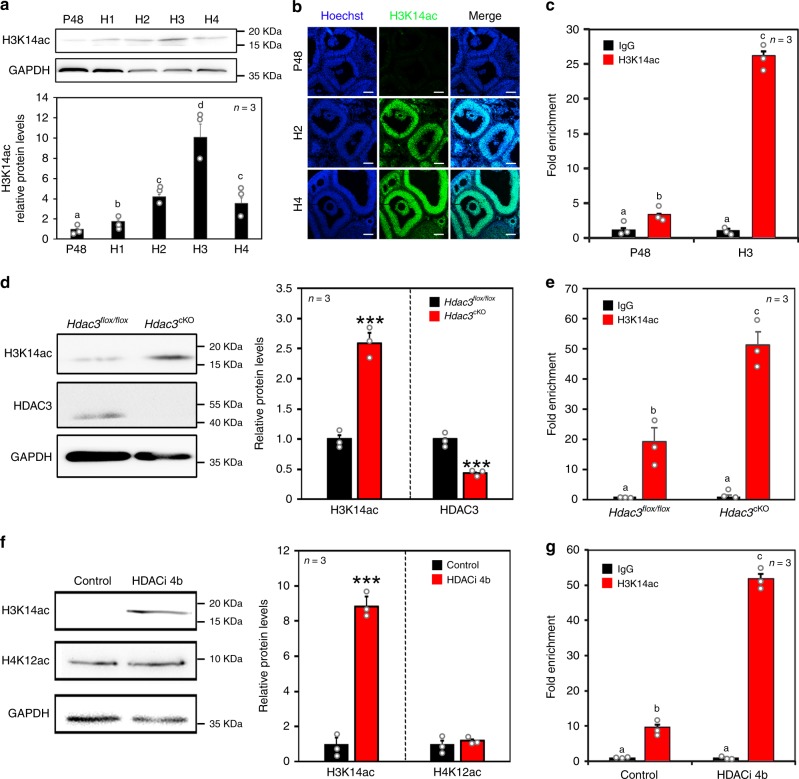
Fig. 3. H3K14ac mediated the effects of HDAC3 and LH on Areg expression.
a H3K14ac levels were increased by hCG in a time-dependent manner. n = 3 biologically independent experiments. Data are presented as mean ± SEM, and different letters (a–d) indicate significant differences among groups (two-sided ANOVA and Holm–Šidák test), P (a, b) < 0.01, P (a, c) < 0.01, P (a, d) < 0.001, P (b, c) < 0.05, P (b, d) < 0.01, P (c, d) < 0.05. b Immunostaining revealed that LH increased H3K14ac (green) levels in GCs in vivo. Nuclei were dyed with Hoechst (blue). Scale bar = 100 µm. n = 3 biologically independent experiments. c ChIP-qPCR analysis of H3K14ac at the Areg promoter (−343 to −150) before and after the LH surge. P48: 48 h after PMSG treatment. H1–H4: 1–4 h after hCG treatment. Data are presented as mean ± SEM, and different letters (a–c) indicate significant differences among groups (two-sided ANOVA and Holm–Šidák test), P (a, b) < 0.01, P (a, c) < 0.001, P (b, c) < 0.001. d H3K14ac levels in Hdac3flox/flox and Hdac3cKO GCs were quantified by western blotting analysis. n = 3 biologically independent experiments. Data are presented as mean ± SEM. Asterisks (*) indicate significant differences at ***P < 0.001 determined by the two-sided t test. e ChIP-qPCR analysis of H3K14ac at the Areg promoter in Hdac3flox/flox and Hdac3cKO GCs. Data are presented as mean ± SEM, and different letters (a–c) indicate significant differences among groups (two-sided ANOVA and Holm–Šidák test), P (a, b) < 0.001, P (a, c) < 0.001, P (b, c) < 0.05. f Western blotting analysis showed that HDACi 4b (HDAC3 inhibitor) substantially increased H3K14ac levels. n = 3 biologically independent experiments. Data are presented as mean ± SEM. Asterisks (*) indicate significant differences at ***P < 0.001 determined by the two-sided t test. g ChIP-qPCR analysis of H3K14ac at the Areg promoter in control and HDACi 4b-treated GCs. Data are presented as mean ± SEM, and different letters (a–c) indicate significant differences among groups (two-sided ANOVA and Holm–Šidák test), P (a, b) < 0.001, P (a, c) < 0.001, P (b, c) < 0.001. Source data are provided as a Source Data file.

