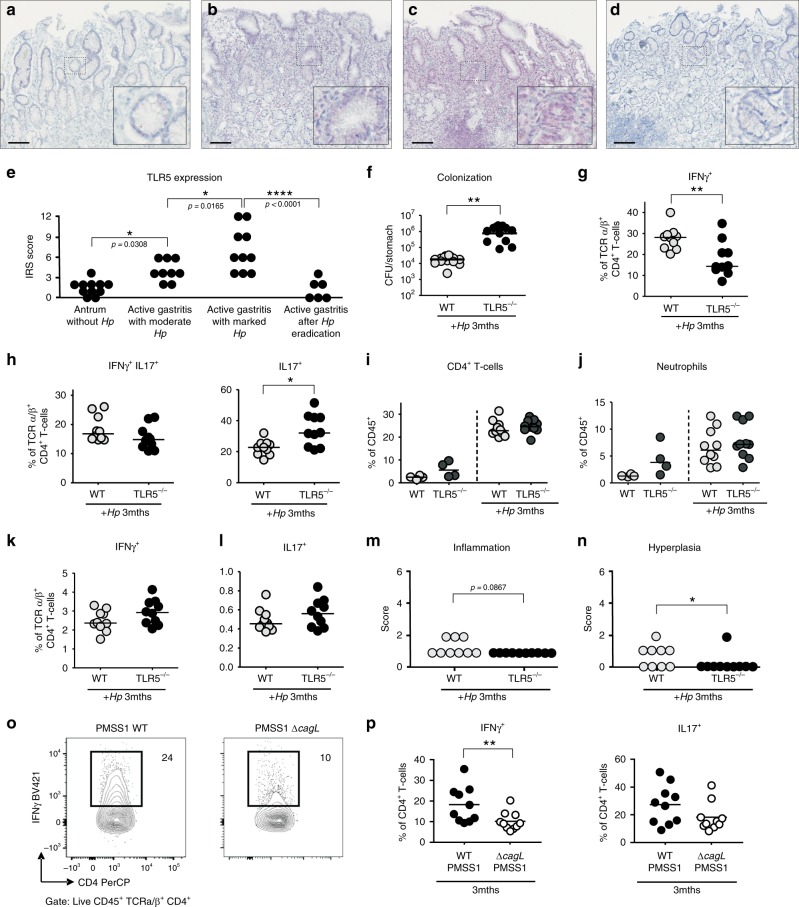
Fig. 4. TLR5 responses in the gastric mucosa of H. pylori-infected patients and mice.
a–d Immunohistochemistry of TLR5 expression in gastric biopsies of patients. Scale bar: 200 µm. Non-infected antrum mucosa (a) exhibits neither pathological changes nor TLR5-positive cells, whereas antrum mucosa (b) with moderately chronic, slightly active gastritis and moderate H. pylori colonization shows cytoplasmic and nuclear TLR5 staining of the surface epithelium and cytosolic staining of plasma cells. c Antrum mucosa with chronic moderately active gastritis in the presence of marked H. pylori colonization with a basal lymphoid follicle and slight intestinal metaplasia with slight atrophy of glands shows strong cytoplasmic and nuclear TLR5 staining of the epithelium and cytosolic staining of plasma cells. d Antrum mucosa of a gastritis patient who underwent treatment for bacterial eradication. TLR5-expression was reduced to non-infected control levels. e ImmunoReactive Score (IRS) quantification of TLR5 staining in patients. *p ≤ 0.05; ****p < 0.0001 (one-way ANOVA). f–n tlr5−/− and wild-type (WT) mice were infected with H. pylori for three months (+Hp 3mths). f Bacterial colonization as determined by plating and colony counting. g frequencies of IFN-γ+, h IL-17+ and of cells expressing both cytokines, among gastric lamina propria CD4+ TCRα/β+ T cells, as determined by flow cytometry. i, j Frequencies of lamina propria CD4+ T cells and Ly6G+ neutrophils among all CD45+ leukocytes. k, l Frequencies of IFN- γ + and IL-17+ cells among all MLN CD4+ TCR α/β+ T cells. m, n Gastric inflammation and hyperplasia, respectively, as scored on a scale of 0–6 based on the updated Sydney classification on two Giemsa-stained sections per mouse. o, p WT mice were infected with H. pylori PMSS1 WT or its CagL-deficient mutant for three months. Frequencies of IFN-γ+ and IL-17+ cells, among gastric lamina propria CD4+ TCRα/β+ T cells, as determined by flow cytometry. The nonparametric Mann–Whitney U-test was used for all statistical comparisons (f–p); *p < 0.05; **p < 0.01; ***p < 0.001. Source data are provided as a Source Data file.

