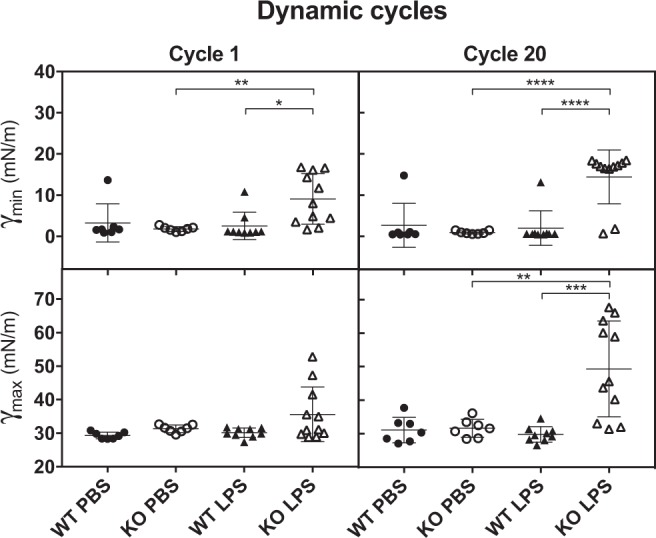
Fig. 6. Pulmonary surfactant of LPS-instilled SP-D−/− (KO) mice show surfactant dysfunction.

Minimal (γmin) and maximum (γmax) surface tensions of LS (10 mg/mL) from the different mouse groups during compression-expansion cycling. Symbols represent data obtained from individual mouse (average of three replicates). WT-PBS (n = 7), KO-PBS (n = 7), WT-LPS (n = 9), KO-LPS (n = 11); (One-way ANOVA with Tukey’s multiple comparison post-test, Cycle 1 (γmin) F(3,30) = 5.547, p = 0.0038; Cycle 20 (γmin) F(3,30) = 15.95, P < 0.0001; Cycle 1 (γmax) F(3,30) = 3.275, p = 0.0346; Cycle 20 (γmax) F(3,30) = 11.62, p < 0.0001; post-test **p < 0.01; ***p < 0.001; ****p < 0.0001). Supplementary Fig. 8: initial adsorption of LS of all the experimental mouse groups. Supplementary Fig. 9: individual examples of the CBS isotherms for individual mouse of all experimental groups.
