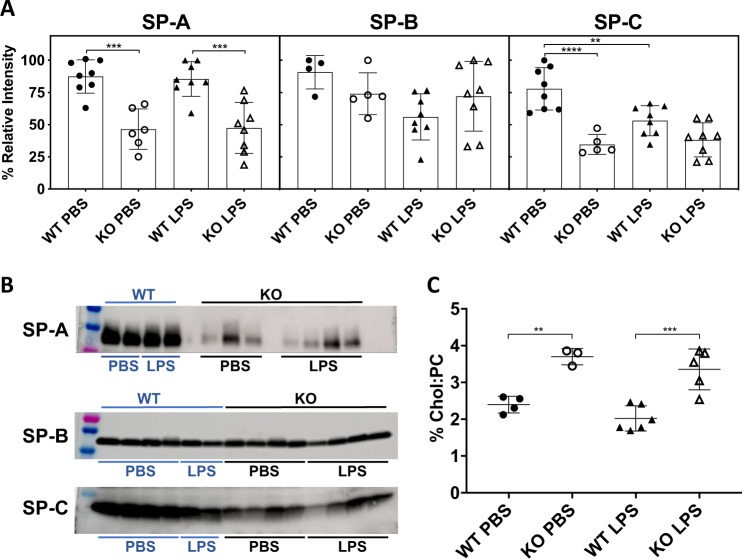
Fig. 7. SP-A, SP-B and SP-C concentrations, and cholesterol content in the surfactant isolated from SP-D+/+ (WT) and SP-D−/− (KO) mice.
a Densitometry of the bands of surfactant proteins revealed in Western blots for LS samples from all mice groups; SP-A: WT-PBS (n = 8), KO-PBS (n = 8), WT-LPS (n = 6), KO-LPS (n = 8), One-way ANOVA with Tukey’s multiple comparison post-test F(3,26) = 15.78, p < 0.0001; SP-B: WT-PBS (n = 4), KO-PBS (n = 8), WT-LPS (n = 5), KO-LPS (n = 8), One-way ANOVA with Tukey’s multiple comparison post-test F(3,21) = 2.659, p = 0.0746; SP-C: WT-PBS (n = 8), KO-PBS (n = 8), WT-LPS (n = 5), KO-LPS (n = 8), One-way ANOVA with Tukey’s multiple comparison post-test F(3,25) = 16.17, p < 0.0001. Graph **p ≤ 0.01; ***p ≤ 0.001; ****p < 0.0001. b Representative Western blots for SP-A, SP-B, and SP-C from the different mouse groups, complete membranes are shown in Supplementary Fig. 10. c [cholesterol]/[phosphatidylcholine] ratio, WT-PBS (n = 4), KO-PBS (n = 3), WT-LPS (n = 6), KO-LPS (n = 5), One-way ANOVA with Tukey’s multiple comparison post-test F(3,25) = 16.17, p < 0.0001; **p ≤ 0.01; ***p ≤ 0.001.

