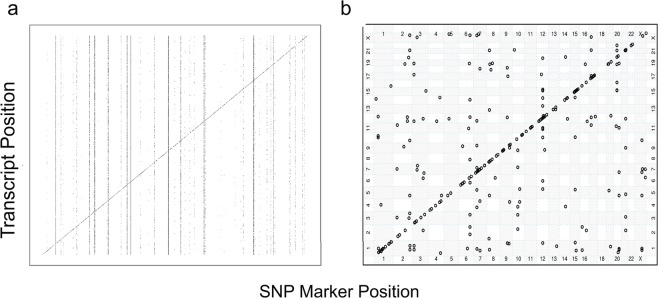
Figure 1.
Genome-wide distribution of transcript-level eQTLs in CRBL. (a) Simulated eQTL data in linkage equilibrium for a single simulation and (b) observed eQTL data. Each point in both plots represents an eQTL between (the SNP on different chromosomes on the x-axis) and (the transcript on different chromosomes on the y-axis). The clear diagonal band represents cis-acting eQTLs while the off-diagonal points represent trans-acting eQTLs (defined as eQTL with a difference between the SNP and transcript site of at least 3.16 Mb). There are many more points in the simulated data plot (a) as these are the simulated “true” eQTLs, many of which are not detected in the subsequent eQTL mapping analysis. As an example, 2.19% of “true” eQTLs were detected across all simulations.

