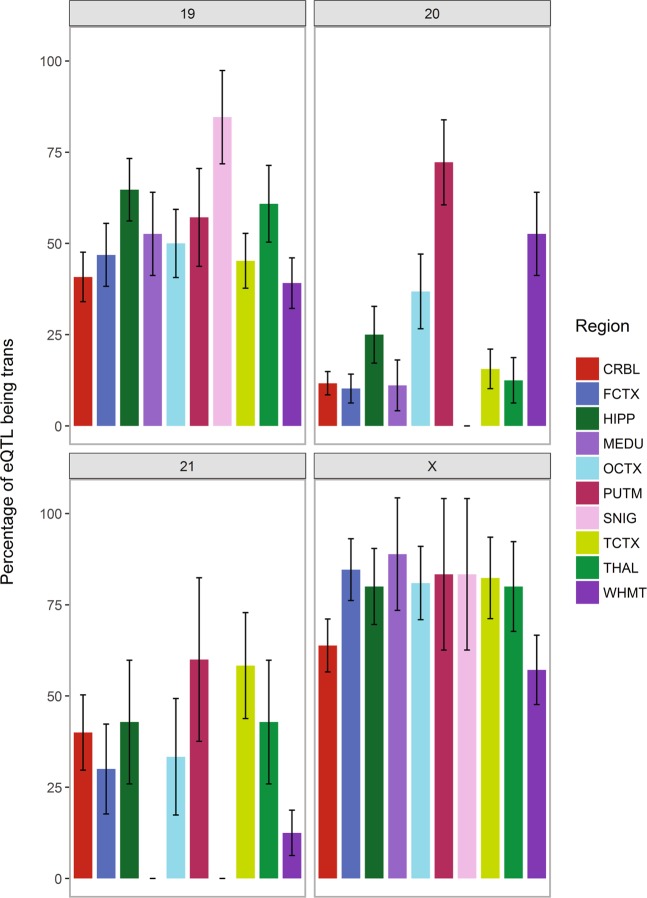
Figure 12.
Percentage of exon-level eQTLs that are trans-acting for all regions on selected chromosomes. Transcript Chr 19, 20, 21 and X were chosen to demonstrate the significant interaction between region and chromosome on the percentage of exon-level trans-acting eQTLs. For example, across the four chromosomes, the putamen (PUTM) shows a constantly high percentage of trans-acting eQTLs (also seen in (b) while the substantia nigra (SNIG) has more variability, high on transcript Chr 19 and X but none on transcript Chr 20 and 21. Transcript Chr X shows a high percentage of trans-acting eQTLs for all regions, highlighting what was shown in (a).

