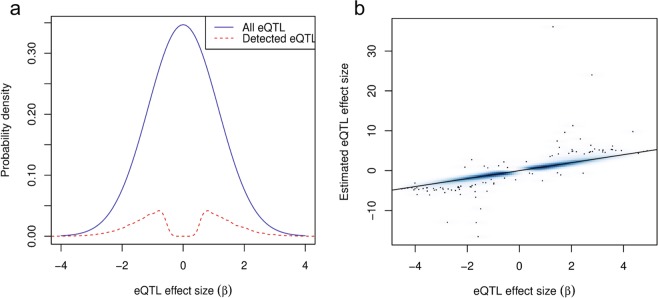
Figure 2.
Distribution of simulated eQTL effect sizes. (a) The distribution of effect sizes of all eQTLs (in blue) compared to the distribution of effect sizes of detected eQTLs (in red). These effect sizes are based on the simulations of the scenario with SNPs in linkage equilibrium (LE) with a false discovery rate (FDR) threshold of 0.01 and nsample = 150. At larger eQTL effect sizes (|β| ≥ 1), eQTLs are more likely to be detected but it is clear that many eQTLs are not being detected (97.8% in across all simulations). There is a dip in the distribution of detected eQTL effect sizes around β = 0 due to the stringency of the FDR threshold (≤0.01). (b) A smoothed scatter plot of estimated versus actual eQTL effect sizes, for those that were detected. Like (a), these effect sizes are from the simulations of the LE scenario with a FDR threshold of 0.01 and n = 150. Overall, the estimated effect sizes of eQTLs when they are detected are accurate, though there are a few outliers.

