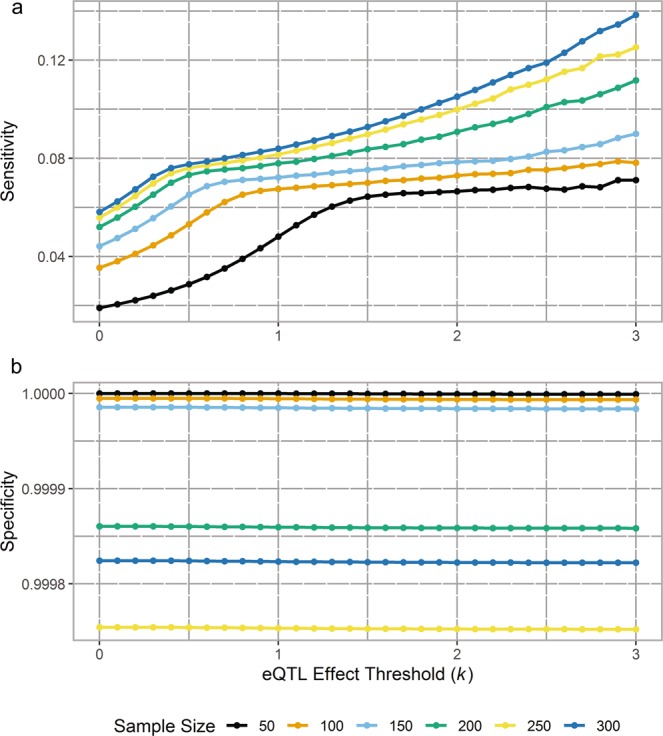
Figure 3.

The sensitivity (a) and specificity (b) to detect eQTLs at a range of effect size thresholds for the scenario with linkage equilibrium (LE). (a) The plot shows the average sensitivity from 100 simulations in each sample size (n = 50, 100, 150, 200, 250, 300) to detect a range of eQTL effect size thresholds, k (0–3 in 0.1 increments). As both sample size and effect size threshold increase, the sensitivity to detect eQTLs increases. However, sensitivity is very low across all sample sizes and effect size thresholds, with the greatest level of sensitivity (i.e. when n = 300, k = 3) being less than 0.14. At lower effect size thresholds, sensitivity to detect eQTLs across sample sizes (except n = 50) is comparable. (b) The plot shows the average specificity from 100 simulations in each sample size (n = 50, 100, 150, 200, 250, 300) to detect a range of eQTL effect size thresholds, k (0–3 in 0.1 increments). As sample size increases, the specificity to detect eQTLs decreases across k with largest decrease of 2.5 × 10⁻⁴ at k = 3 when n increases from 50 to 250. However, specificity is very high across all sample sizes and effect size thresholds with the lowest level of specificity (i.e. when n = 250, k = 3) being greater than 0.9997. For each sample size, there is virtually no discernible decrease in specificity as the effect size threshold increase
