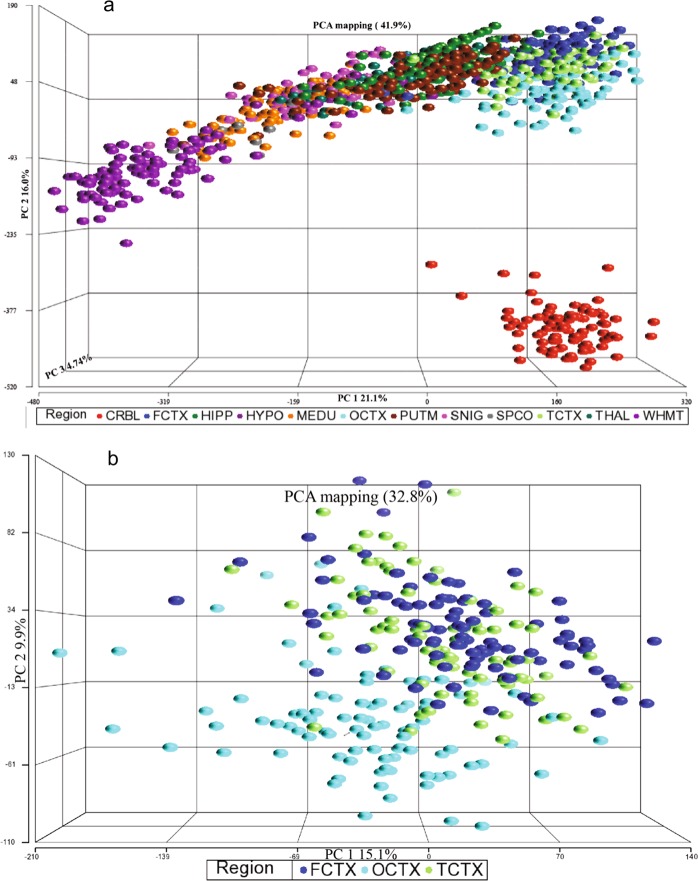
Figure 6.
First three principal component scores of (a) all CNS-regions and (b) three cortex regions. These are 3D scatterplots of the first three PCs from a PCA on the expression data of (a) 12 brain regions (cerebellum, frontal cortex, hippocampus, hypothalamus, medulla, occipital cortex, putamen, substantia nigra, spinal cord, temporal cortex, thalamus, and white matter) and (b) the three cortices (frontal, occipital and temporal). Each point represents a single brain sample from a specific region with regions colour coded to demonstrate regional differences in expression values. Looking at all regions, the first three components explain 41.9% of the variability in expression values across all transcripts. The cerebellum region (CRBL; red spheres) cluster separately from the other 11 regions indicating that the expression pattern in this region is unique. In addition, white matter (WHMT; purple spheres) also shows a separate cluster demonstrating different expression patterns than other regions. Looking at the cortex regions, the first three components explain 32.8% of the variability in expression values across all transcripts. The occipital cortex region (OCTX; light blue spheres) is clustering separately from the frontal cortex (FCTX; dark blue spheres) and the temporal cortex regions (TCTX; light green spheres), indicating that the expression pattern is more distinct in this region.

