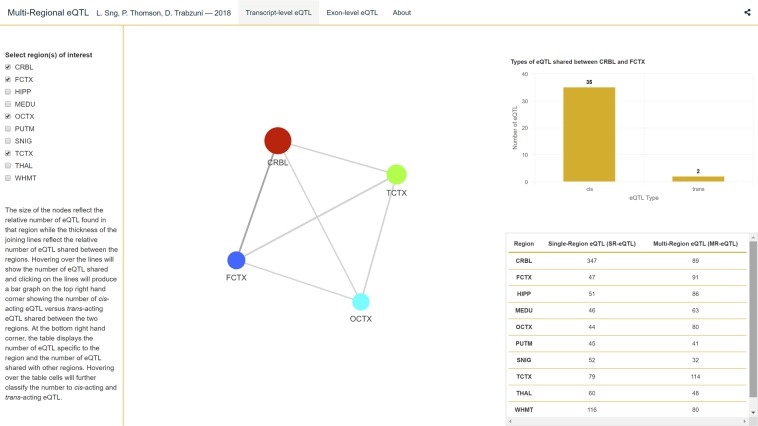
Figure 7.
A screen capture of the Shiny App. In this app, users can visualise the MR-eQTL patterns between specific regions of interest. The diameter of each sphere is proportional to the number of eQTLs associated with the region of the brain. The width of the line connecting a pair of regions is proportional to the number of eQTLs in common between those two regions with the actual number presented for the cis/trans-acting eQTLs. There are two pages, one for transcript-level and another for exon-level. The app can be found at https://lmf-sng.shinyapps.io/Multi-Regional_eQTL/.

