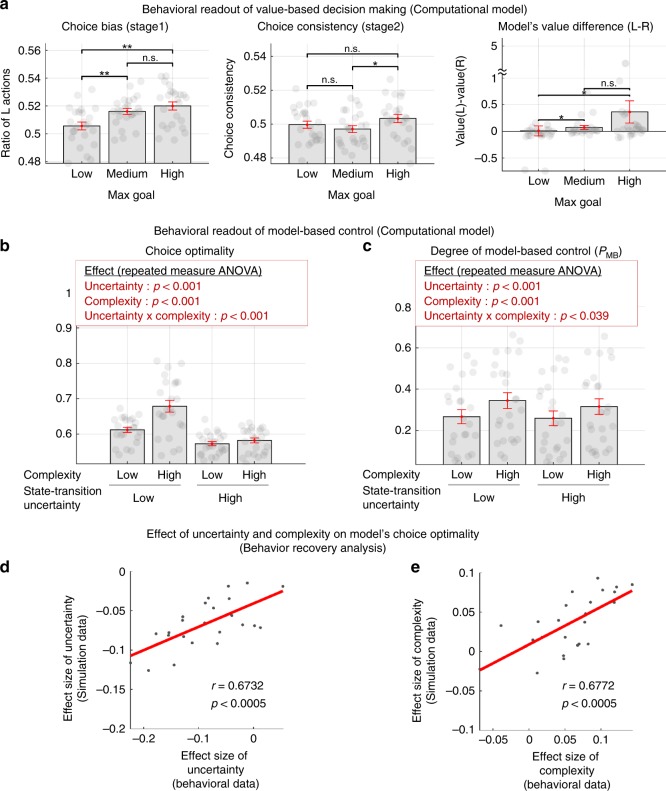
Fig. 6. Computational model fitting results.
a Choice bias (left), choice consistency (middle), and the average value difference (right) of our computational model of arbitration control (Fig. 5b). For this, we ran a deterministic simulation in which the best-fitting version of the arbitration model, using parameters obtained from fitting to participants behavior, experiences exactly the same episode of events as each individual subject, and we generated the trial-by-trial outputs. The max goal conditions are defined in the same way as in the Fig. 2a. Error bars are SEM across subjects. Note that both the choice bias and choice consistency patterns of the model (the left and the middle plot) are fully consistent with the behavioral results (Fig. 2b). Second, the values difference (left–right choice) of the model is also consistent with this finding (the right plot), suggesting that these behavioral patterns are originated from value learning. In summary, our computational model encapsulates the essence of subjects’ choice behavior guided by reward-based learning. b Patterns of choice optimality generated by the best-fitting model, using parameters obtained from fitting to participants behavior. For this, the model was run on the task (1000 times), and we computed choice optimality measures in the same way as in Fig. 3. c Degree of engagement of model-based control predicted by the computational model, based on the model fits to individual participants. PMB corresponds to the weights allocated to the MB strategy. Shown in the red box are the effect of the two experimental variables on each measure (two-way repeated measures ANOVA; also see Supplementary Table 4 for full details). Error bars are SEM across subjects. d, e Behavioral effect recovery analysis. The individual effect sizes of uncertainty (d) and complexity (e) on choice optimality of subjects (true data) were compared with those of our computational model (simulated data).

