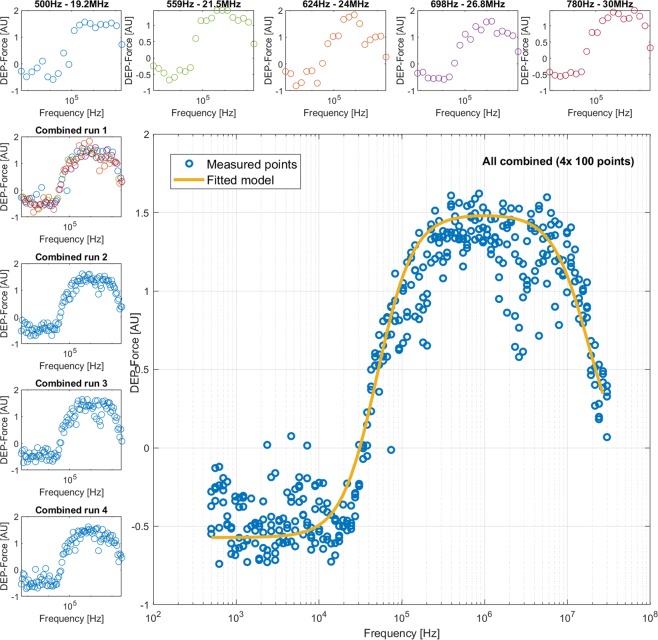
Figure 4.
In order to provide ultra-high-resolution (100-point) DEP spectra, K452 cells were analysed by 20-point spectra (top row) that, when combined, provided a single spectrum with 100 equally-spaced points (shown here as Combined run 1). Three more 100-point spectra (Combined runs 2–4) were performed separately; these were then combined into a single 400-point spectrum (main panel). Best-fit models were generated for the 400-point spectrum (shown) and compared to best-fit models for 100-point and 20-point spectra in order to determine whether 20 points is as accurate as higher-resolution spectra for robust data extraction.

