
Figure 7.
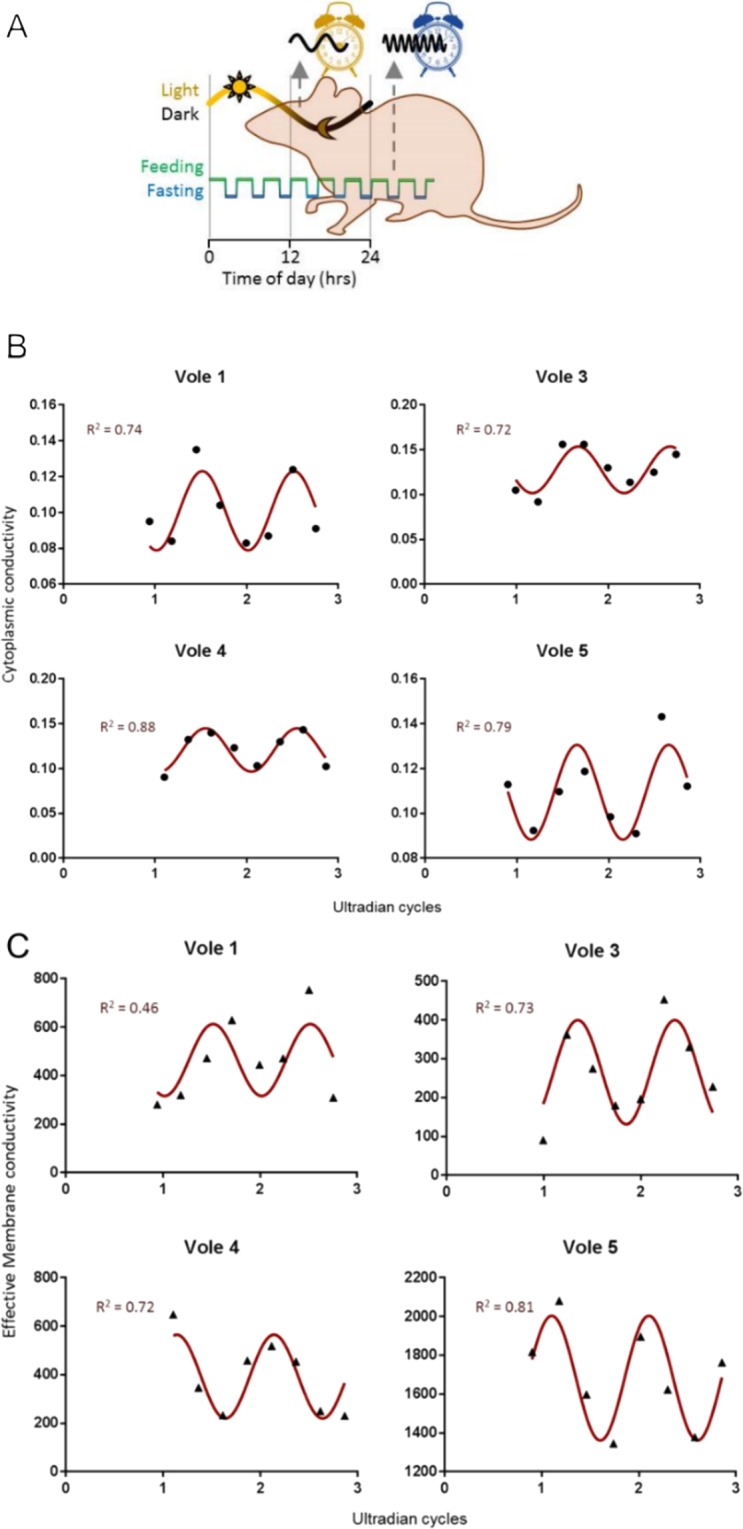
Whole blood assay. (A) In nature and the laboratory, the common vole expresses short (ultradian) feeding-fasting and sleep-wake cycles, whilst being under a circadian light-dark cycle. (B) DEP measures of cytoplasmic conductivity fits to a series of consecutive vole blood sample for 4 voles, fitted with a cosinor curve. Data points (black circles) are mean parameters determined by at least n = 3 spectra fits at each time point. R2 values indicate the goodness of fit to the cosinor curve determined by the phase of observed activity (actogram) and fitted amplitude and mesor (mean estimating statistic of rhythm) to DEP data (red line). (C) DEP measures of effective membrane conductivity fits to a series of consecutive vole blood sample for 4 voles, fitted with a cosinor curve. Data points (black circles) are mean parameters determined by at least n = 3 spectra fits at each time points. r2 values indicate the goodness-of-fit to the cosinor curve determined by the phase of the actogram and fitted amplitude and mesor to DEP data (red line).