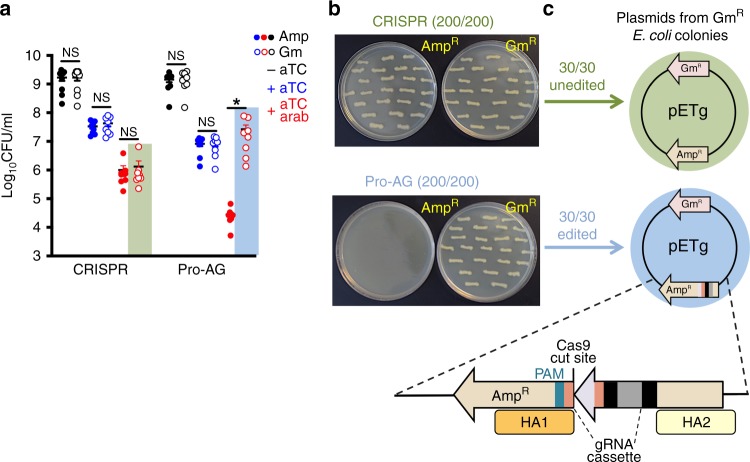
Fig. 2. Efficient reduction of AmpR CFU by Pro-AG results from homology-mediated insertion of active gRNA cassettes into the bla target gene.
a Selection for E. coli CFU on ampicillin (Amp, filled dots) or gentamicin (Gm, open dots) plates following CRISPR-control- or Pro-AG-mediated targeting of the dual antibiotic-resistant target plasmid pETg (see pETg plasmid schematic in c from single colonies grown in the presence (+ aTc, blue dots), in the absence (−aTc, black dots) of anhydrotetracycline for induction of Cas9, or in combination of aTc and arabinose (+ aTc + arab, red dots) for induction of Cas9 and λRed, respectively. b Individual colonies isolated from gentamicin plates following Cas9 and λRed induction under CRISPR (green shaded box) or Pro-AG (blue shaded box) regimens in a were streaked on new ampicillin (AmpR, left images) and gentamicin (GmR, right images) plates. Representative images of 200 colonies struck from CRISPR-control (top) or Pro-AG (bottom) are shown. c DNA sequence analysis of plasmids isolated from single colonies in b recovered from either the CRISPR-control regimen (AmpR or GmR plates; green arrow) or the Pro-AG regimen (GmR plates; blue arrow). All 30 CRISPR-derivative clones analyzed revealed a fully intact pETg plasmid (unedited, green circle), whereas all 30 Pro-AG-derivative clones analyzed carried a perfect insertion of the homology-flanked gRNA2 expression cassette into the bla gene (zoom-in bottom scheme). The gRNA expression cassette is composed of the gRNA scaffold (purple), 20 bp gRNA-targeting sequences (pink and black), and the constitutive tet promoter (gray). Also indicated are the Cas9 cleavage site, and homology arms (HA1, dark yellow box and HA2, light yellow box) that flank the gRNA2 cleavage site in the bla target gene carried on the pETg plasmid. Data in a are plotted as the mean ± SEM, representing three independent experiments performed in triplicate and analyzed by Student’s t test. N.S. = not significant (P > 0.05) *P < 0.05. Source Data are available in the Source Data file.

