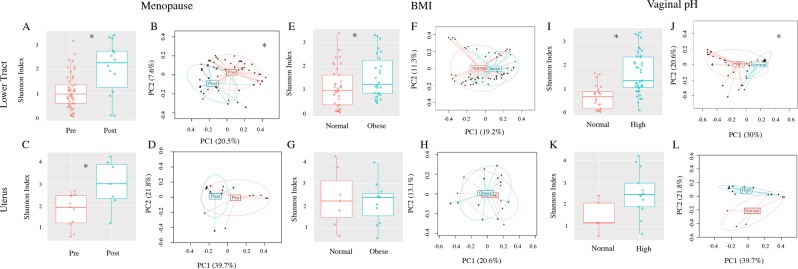
Figure 1.
Influence of patient factors on bacterial community diversity among patients without EC. Both α- (Shannon index) and β-diversity measures were compared. For α-diversity a Wald statistical test was performed. For β-diversity, omnibus p values are reported combining the evidence across the Bray-Curtis, unweighted, weighted, and generalized UniFrac distance metrics. The most significant metric is shown in each ordination plot. Lower tract (cervix and vagina). (A) Pre vs post-menopause α-diversity p = 0.002. (B) Pre vs post-menopause β-diversity unweighted UniFrac (omnibus p = 0.007), uterus. (C) Pre vs post-menopause α-diversity p = 0.024. (D) Pre vs post-menopause β-diversity weighted UniFrac (omnibus p = 0.221), lower tract. (E) Obese vs normal BMI α-diversity p = 0.019. (F) Obese vs normal BMI β-diversity unweighted UniFrac (omnibus p = 0.09), uterus. (G) Obese vs normal BMI α-diversity p = 0.47. (H) Obese vs normal BMI β-diversity unweighted UniFrac (omnibus p = 0.514), lower tract. (I) Normal vs high vaginal pH α-diversity p = 2.871E−5. (J) Normal vs high vaginal pH β-diversity generalized UniFrac (omnibus p = 0.001) and uterus. (K) Normal vs high vaginal pH α-diversity p = 0.112. (L) Normal vs high vaginal pH β-diversity weighted UniFrac (omnibus p = 0.062). Uterus premenopause N = 11, postmenopause N = 7; Lower tract premenopause N = 49, postmenopause N = 14. Uterus normal BMI N = 7, obese BMI N = 11; Lower tract normal BMI N = 38, obese BMI N = 26. Uterus normal pH N = 5 and high pH N = 13; Lower tract normal pH N = 24, high pH N = 39. For each primary comparison, the PERMANOVA tests were adjusted for the two remaining factors (menopause status, pH, obesity). *Groups are significantly different.

