Figure 6.
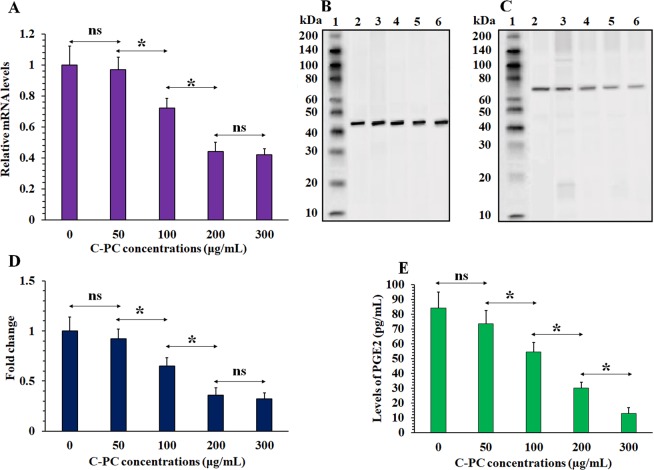
Evaluation of C-PC treatment effect on the COX-2 expression in the CT-26 cells. (A) The relative levels of COX-2 mRNA at the CT-26 cells after treatment with different concentrations of C-PC (0, 50, 100, 200, and 300 µg/mL) according to qRT-PCR analyses. (B) western blot analyses of beta-actin and (C) COX-2 proteins expression after treatment with different concentrations of C-PC (0, 50, 100, 200, and 300 µg/mL). The 1, 2, 3, 4, 5, and 6 lanes represent the protein marker, 0, 50, 100, 200, and 300 µg/mL samples, respectively. The figure displays the full-length blots with no cropping. (D) The normalized COX-2 protein levels at different treatment groups (0, 50, 100, 200, and 300 C-PC µg/mL). (E) The PGE2 level at the CT-26 cells’ culture media after 24 h incubation with different concentrations of C-PC (0, 50, 100, 200, and 300 µg/mL). (*P < 0.05, ns: not significant).

