Figure 7.
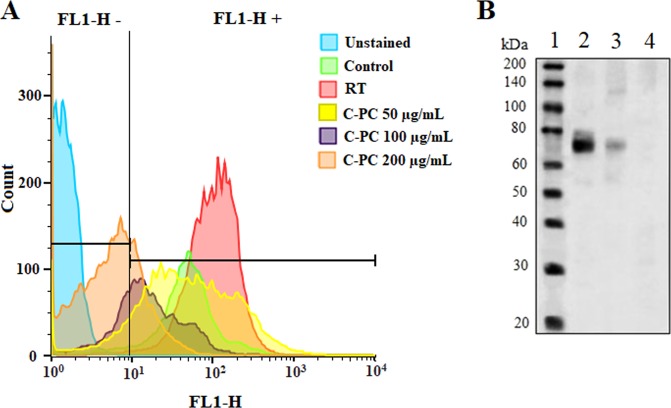
Investigation of C-PC effect on the cancer cells’ COX-2 expression in vitro and in vivo. (A) Flow cytometry analyses of COX-2 expression at the CT-26 cancer cells after incubation with different concentrations of C-PC (50, 100, and 200 µg/mL) and radiation therapy. The control cells were treated with PBS. The unstained cells were not incubated with anti-COX-2 antibody to identify the FL1-H+ and FL1-H- regions (FL1-H+: COX-2 positive region, FL1-H-: COX-2 negative region). Also, a group of wells was just irradiated (6 Gy) to identify the radiation therapy effect on COX-2 expression. (B) Western blot analysis of COX-2 expression in the tumors of C-PC treated (lane 3) tumor-bearing mice. Lane 2 exhibits the no-treated tumor-bearing mice’s tumors as positive control. The lanes 1 and 4 are presenting the ladder and the lysed MCF-7 cells as the negative control, respectively. The figure displays the full-length blots with no cropping.

