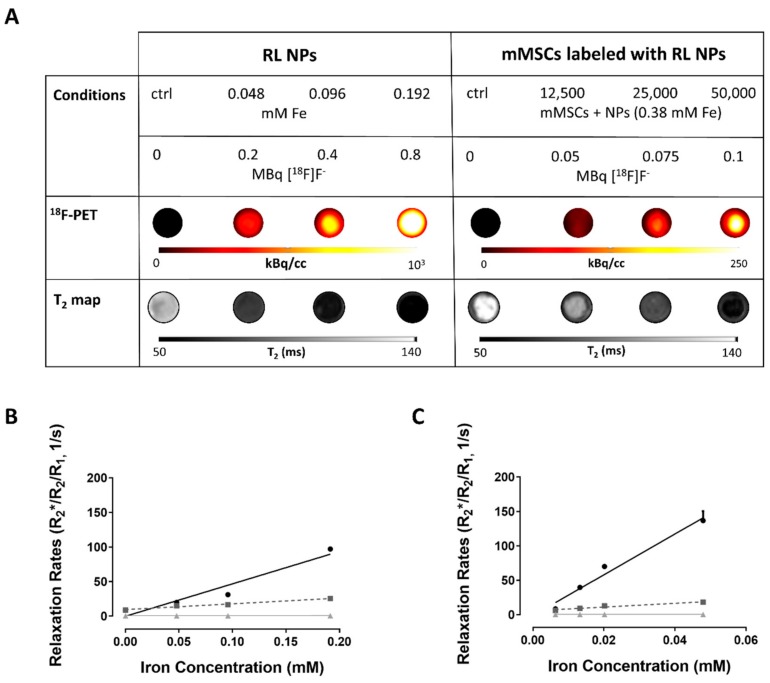
Figure 10.
PET/MRI contrast properties of Fe3O4@Al(OH)3 NPs labeled with [18F]F- and mouse mesenchymal stem cells (mMSCs) labeled with such NPs: (A) Upper row: The different conditions measured with the estimated radioactivity present at the start of measurements. Samples (100 µL) were diluted ½ with agar. Middle: 18F-positron emission tomography (PET) images and Bottom: T2 maps of the agar phantoms loaded with either radiolabeled Fe3O4@Al(OH)3 NPs (left) or mMSCs labeled with radiolabeled Fe3O4@Al(OH)3 NPs (right). (B,C) Relaxation rate (R1/2/2*) plotted against (B) iron concentration (mM) of Fe3O4@Al(OH)3 NPs or (C) intracellular iron concentration (mM) of mMSCs labeled with different amounts of radiolabeled Fe3O4@Al(OH)3 NPs. The following cell densities were studied: 12,500, 25,000, and 50,000 cells in 200 µL: 62,500 cells/mL, 125,000 cells/mL, and 250,000 cells/mL, respectively. The intracellular iron concentrations were obtained for 50,000 labeled cells.

